
热门标签
热门文章
- 1Windows10 Docker 容器使用,每个步骤作者亲测,细节记录最全教程_win10系统的容器
- 2⭐算法入门⭐《递推 - 二维》简单01 —— LeetCode 118. 杨辉三角_二维递推
- 3springboot014校园管理系统的设计与实现_基于springboot的班级管理系统的设计与实现
- 4Java MongoDB:(十三)MongoDB 的文档操作-Limit 函数与 Skip 函数_java集成mongo分页查询的skip和limit有什么区别
- 5Matlab常用求解数学规划模型代码_matlab数学模型代码
- 6基于树莓派4B与STM32的UART串口通信实验(代码开源)_树莓派4b串口波特率
- 7【图论·习题】走廊泼水节(Kruscal算法逆推)
- 8力扣hot100 柱状图中最大的矩形 单调栈
- 9MSB 和 LSB_spi msb
- 10Spring-Boot导入配置文件与取值
当前位置: article > 正文
keras实现LFW测试_lfw 精度评价指标代码
作者:代码优化者 | 2024-01-28 23:42:35
赞
踩
lfw 精度评价指标代码
部分代码由朋友提供,如有侵权,请及时联系。
1、裁剪图像。
可以自己写,但有时候会出现漏检测。其次,也可以网上下载,但是需要写脚本处理图像的格式以及进行再分类。
网上下载地址:http://conradsanderson.id.au/lfwcrop/
2、读取pairs文件,生成自己的label文件,每行包含图像位置信息以及标签(0-不同人,1-同一个人)
读取
    def read_pairs(self, pairs_filename):
        pairs = []
        f = open(pairs_filename, 'r')
        while True:
            line = f.readline().strip('\n').split()
            if not line:
                break
            if len(line) ==3 or len(line) == 4:
                pairs.append(line)
        #print(pairs)
        return pairs
- 1
- 2
- 3
- 4
- 5
- 6
- 7
- 8
- 9
- 10
- 11
生成
    def get_paths(self, ori_path, pairs):
        ori_path = 'E:/sign_system/lfw/'
        file = open('E:/sign_system/execute_system/testcode/labelcrop_3.txt', 'w')
        labellines = []
        for i in range(0, len(pairs)):
            if len(pairs[i]) == 3:
                labelline = ori_path+pairs[i][0] + '/' + pairs[i][0] + '_' + \
                '%04d' % int(pairs[i][1]) + '.jpg' + '\t' +ori_path + '/' + \
                pairs[i][0] + '/' + pairs[i][0] + '_' +'%04d' % int(pairs[i][2])\
                + '.jpg' + '\t' + '1\n'
                labellines.append(labelline)
            elif len(pairs[i]) == 4:
                labelline = ori_path+pairs[i][0] + '/' + pairs[i][0] + '_' + \
                '%04d' % int(pairs[i][1]) + '.jpg' + '\t' + ori_path + '/' +\
                pairs[i][2] + '/'+ pairs[i][2] + '_' + '%04d' % int(pairs[i][3])\
                + '.jpg' + '\t' + '0\n'
                labellines.append(labelline)
            else:
                print("error!!!!")
        file.writelines(labellines)
        file.close()

- 1
- 2
- 3
- 4
- 5
- 6
- 7
- 8
- 9
- 10
- 11
- 12
- 13
- 14
- 15
- 16
- 17
- 18
- 19
- 20
- 21
3、再次读取文件,生成label文件中同一行的左右图像特征
读取label文件
    def readImagelist(self,labelFile):
        file = open(labelFile)
        lines = file.readlines()
        file.close()
        left = []
        right = []
        labels = []
        for line in lines:
            path = line.strip('\n').split('\t')
            #read left image
            left.append(path[0])
            #read right image
            right.append(path[1])
            #read label
            labels.append(int(path[2]))
        assert(len(left) == len(right))
        assert(len(right) == len(labels))
        return left, right, labels
- 1
- 2
- 3
- 4
- 5
- 6
- 7
- 8
- 9
- 10
- 11
- 12
- 13
- 14
- 15
- 16
- 17
- 18
提取特征
提取前需要在前面导入模型
        self.model = Model_half()
        path = '‘’(你需要导入模型的地址)
        self.model = load_model(path)
- 1
- 2
- 3
- 4
提取
    def extractFeature(self, leftImageList, rightImageList):

        leftfeature = []
        rightfeature = []
        for i in range(0, len(leftImageList)):

            if (i%200 == 0):
                print("there are %d images done!"%i)

            #读取左边图像,并提取特征
            imagel = cv2.imread(leftImageList[i])
			#图像标准化,为了提取特征
            if K.image_data_format() == 'channels_first' and imagel.shape != (1, 3, 224, 224):
                imagel = resize_image(imagel)
                imagel = imagel.reshape((1, 224, 224, 3))
            elif K.image_data_format() == 'channels_last' and imagel.shape != (1, 224, 224, 3):
                imagel = resize_image(imagel)
                imagel = imagel.reshape((1, 224, 224, 3))
            imagel = imagel.astype('float32')
            imagel /= 255.0
            f1 = self.model.predict(imagel, batch_size = 128)[0]
            leftfeature.append(f1)

            #读取右边图像,并提取特征
            imager = cv2.imread(rightImageList[i])
            if K.image_data_format() == 'channels_first' and imager.shape != (1, 3, 224, 224):
                imager = resize_image(imager)
                imager = imager.reshape((1, 224, 224, 3))
            elif K.image_data_format() == 'channels_last' and imager.shape != (1, 224, 224, 3):
                imager = resize_image(imager)
                imager = imager.reshape((1, 224, 224, 3))
            imager = imager.astype('float32')
            imager /= 255.0
            f2 =self.model.predict(imager, batch_size = 128)[0]
            rightfeature.append(f2)
        return leftfeature, rightfeature
- 1
- 2
- 3
- 4
- 5
- 6
- 7
- 8
- 9
- 10
- 11
- 12
- 13
- 14
- 15
- 16
- 17
- 18
- 19
- 20
- 21
- 22
- 23
- 24
- 25
- 26
- 27
- 28
- 29
- 30
- 31
- 32
- 33
- 34
- 35
- 36
4、计算余弦相似度并做归一化
注意:余弦相似度与余弦距离的区别,可以参考我的文章:https://blog.csdn.net/u010847579/article/details/88893107
求出余弦相似度
    dis = 1-pw.pairwise_distances(leftfeature, rightfeature, metric='cosine')
    distance = np.empty((len(labels),))
    for i in range(len(labels)):
        distance[i] = dis[i][i]
- 1
- 2
- 3
- 4
余弦相似度归一化(这一步也可以不做,看自己的需求)
    distance_norm = np.empty((len(labels)))
    for i in range(len(labels)):
        distance_norm[i] = (distance[i]-np.min(distance))/(np.max(distance)-np.min(distance))
- 1
- 2
- 3
5、计算不同阈值下的精确度,确定最佳精度以及生成tpr,fpr的关系图
计算精确度
    def calculate_accuracy(self,distance, labels, num):
        accuracy = {}
        predict = np.empty((num,))
        threshold = 0.1
        while threshold <= 0.9:
            for i in range(num):
                if distance[i] >= threshold:
                    predict[i] = 1
                else:
                    predict[i] = 0
            predict_right =0.0
            for i in range(num):
                if predict[i] == labels[i]:
                   predict_right += 1.0
            current_accuracy = (predict_right / num)
            accuracy[str(threshold)] = current_accuracy
            threshold = threshold + 0.001
        #将字典按照value排序
        temp = sorted(accuracy.items(), key = lambda d:d[1], reverse = True)
        highestAccuracy = temp[0][1]
        thres = temp[0][0]
        return highestAccuracy, thres
- 1
- 2
- 3
- 4
- 5
- 6
- 7
- 8
- 9
- 10
- 11
- 12
- 13
- 14
- 15
- 16
- 17
- 18
- 19
- 20
- 21
- 22
生成
fpr, tpr, thresholds = sklearn.metrics.roc_curve(labels, distance_norm)
- 1
绘制roc
    def draw_roc_curve(self, fpr,tpr,title='cosine',save_name='roc_lfw'):
        plt.figure()
        plt.plot(fpr, tpr)
        plt.plot([0, 1], [0, 1], 'k--')
        plt.xlim([0.0, 1.0])
        plt.ylim([0.0, 1.0])
        plt.xlabel('False Positive Rate')
        plt.ylabel('True Positive Rate')
        plt.title('Receiver operating characteristic using: '+title)
        plt.legend(loc="lower right")
        pathplt = ''(保存的地址)
        plt.savefig(pathplt)
        plt.show()
- 1
- 2
- 3
- 4
- 5
- 6
- 7
- 8
- 9
- 10
- 11
- 12
- 13
效果,随便拿的一个轻量化模型。
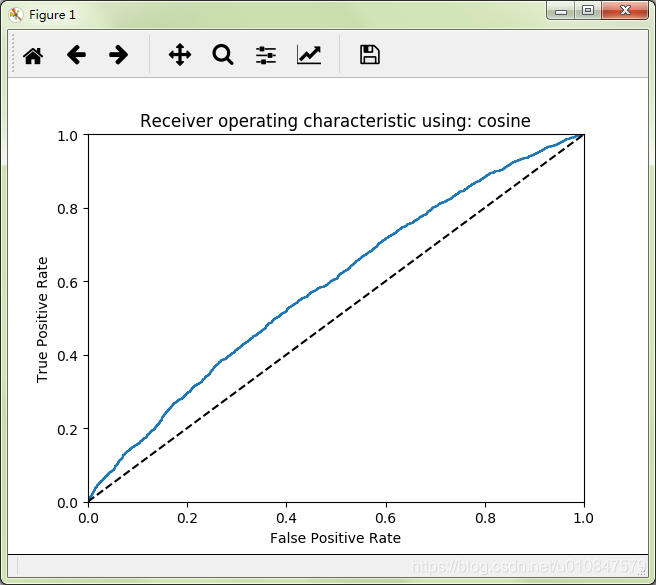

如图,可以看到最高准确率以及对应的阈值。
以上差不多就整体完成了,如有疑问,可以私信留言。
声明:本文内容由网友自发贡献,不代表【wpsshop博客】立场,版权归原作者所有,本站不承担相应法律责任。如您发现有侵权的内容,请联系我们。转载请注明出处:https://www.wpsshop.cn/article/detail/42281
推荐阅读

相关标签

