
热门标签
热门文章
- 1查看docker 容器的端口_docker查看容器端口
- 2分布式文件存储FastDFS介绍安装部署及相关Java代码编写_分布式文件存储代码
- 3OSPF技术连载2:OSPF工作原理、建立邻接关系、路由计算_ospf 邻接关系
- 4了解不一样的Sui NFT标准_sui ntf
- 5CoPE论文爆火!解决Transformer根本缺陷,所有大模型都能获得巨大改进
- 6开源排版软件 Scribus_scribus是开源项目
- 7创新案例 | 最全的跨境电商SHEIN获取流量和打造增长飞轮的经验借鉴_通过案例对sheinside流量来源进行分析
- 8图像匹配天花板:SuperPoint+SuperGlue复现
- 9springboot的JPA在Mysql8新增记录失败的问题_jpa insert如何抛出异常
- 10vue 配置 postcss-px2rem
当前位置: article > 正文
Taro3+Vue3使用echarts_echarts-taro3-vue
作者:空白诗007 | 2024-07-01 23:15:23
赞
踩
echarts-taro3-vue
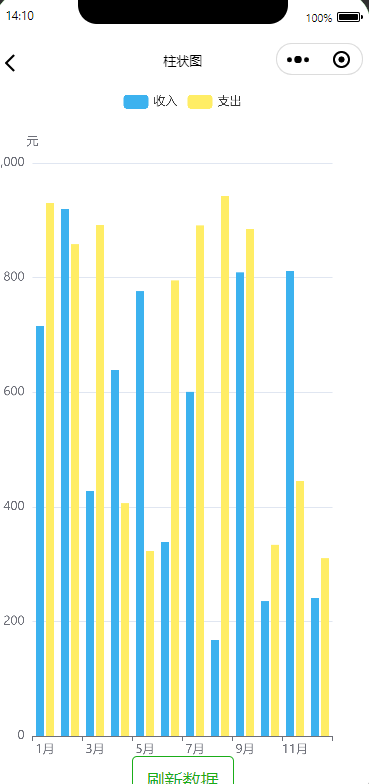
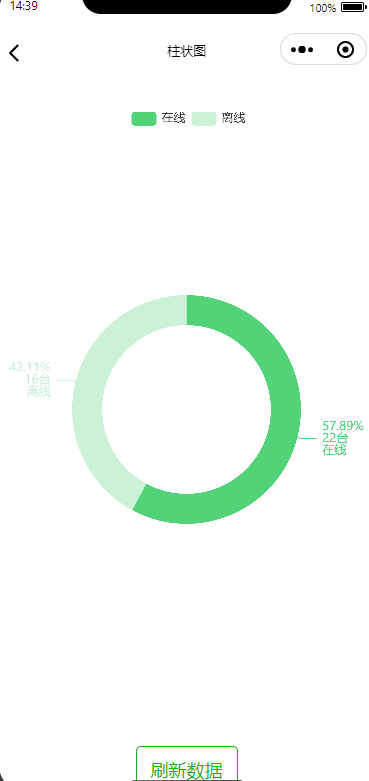
先上图,无图言吊
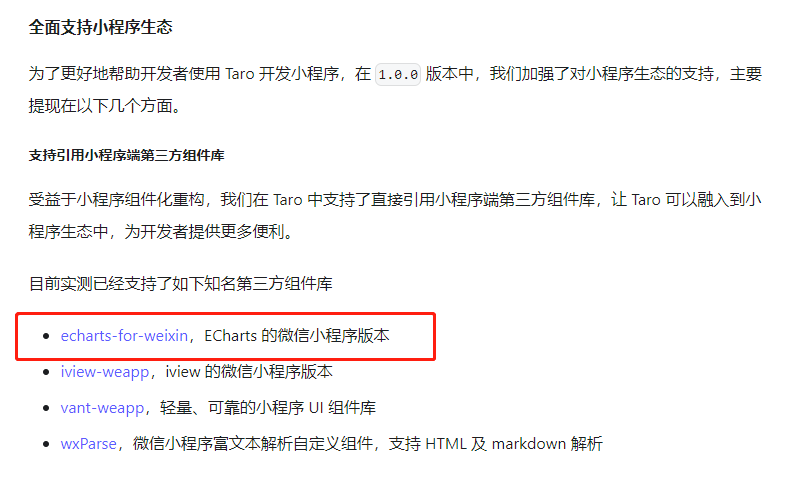
一.taro支持echarts
官方说明:https://taro-docs.jd.com/blog/2018-09-18-taro-1-0-0#支持引用小程序端第三方组件库
二.引入echarts-for-weixin插件
github地址: https://github.com/ecomfe/echarts-for-weixin
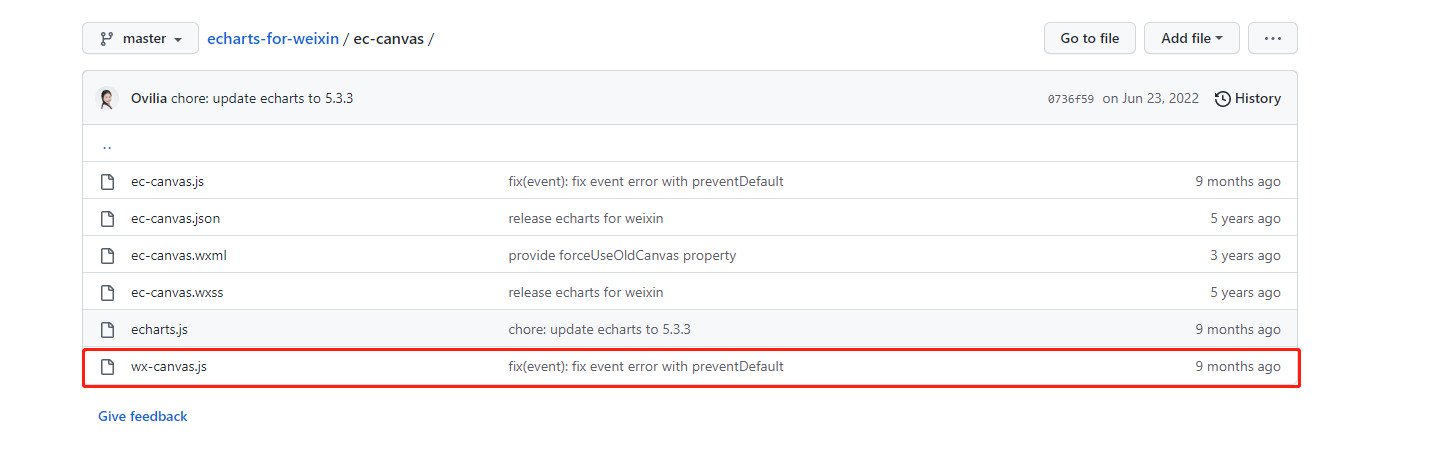
只引入ec-canvas文件夹下的wx-canvas.js
三.自定义 下载echarts
地址: https://echarts.apache.org/zh/builder.html
可自行选择版本,笔者测试了5.3.3和5.4.1都支持
下载后得到echarts.min.js
请根据需要自行选择需要的图表打包下载,我只选了默认的饼图、柱图、线图;
四.封装组件ec-canvas.vue
- <template>
- <canvas type="2d" class="ec-canvas" :canvas-id="canvasId" @touchStart="touchStart" @touchMove="touchMove"
- @touchEnd="touchEnd"></canvas>
- </template>
引入刚才下载的echarts.min.js和wx-canvas
- import Taro from "@tarojs/taro";
- import WxCanvas from "./wx-canvas";
- import * as echarts from "./echarts-5.4.1.min";

五.封装e-chart.vue组件
<script lang=js>
使用js避免引入echarts.min.js报错,要求写声明文件.d.ts
不要使用setup语法糖 <script lang=js setup> 会报错
const ecCanvasRef = ref(null); vue3中使用ref获取组件实例 声明与template中ref变量一致
expose vue3向外暴漏子组件方法,同<setup>语法糖里的defineExpose
六.使用封装的组件
七.易错点
ec-canvas中使用Taro.createSelectorQuery()获取不到dom节点
- const query = Taro.createSelectorQuery();
- query
- .select(".ec-canvas")
- .fields({
- node: true,
- size: true
- })
- .exec(res=>{
-
- })
Taro.createSelectorQuery()获取节点必须在页面渲染完成后,否则获取到的是null;
在组件和页面里获取略有不同,Taro.createSelectorQuery().in(this)在页面里获取
声明:本文内容由网友自发贡献,不代表【wpsshop博客】立场,版权归原作者所有,本站不承担相应法律责任。如您发现有侵权的内容,请联系我们。转载请注明出处:https://www.wpsshop.cn/w/空白诗007/article/detail/777979
推荐阅读
相关标签

