
- 1Linux使用 lvresize扩展或缩减LV大小 (二)
- 2案例分享:当前高端低延迟视频类产品方案分享(内窥镜、记录仪、车载记录仪、车载环拼、车载后视镜等产品)
- 3Linux系统中文件被删除后的恢复方法(ext4)_linux 旧版本 系统删除了fstab
- 4软件文档相关缩写_csc和csu
- 5Docker build 太慢解决方法_docker build 慢
- 6洛谷B3624猫粮规划
- 7python实现读取pdf格式文档_python读取pdf
- 8正则表达式与文本处理工具
- 9Mybatis源码解析【一二级缓存】_mybatis一级缓存和二级缓存源码
- 10Spring Boot和Spring的区别_spring和springboot
配置Prometheus采集SpringBoot数据并在Grafana实时监控_jvm_gc_pause_seconds_count
赞
踩
1 简介
Prometheus作为可靠的数据采集工具,常用于后台系统的流量、CPU利用率、时延等指标数据采集。
Grafana作为指标展示工具,常用于后台系统的流量、CPU利用率、时延等指标数据展示,并可针对不同的指标配置告警。
本文以SpringBoot后台系统为例,讲解Prometheus采集后台接口相关数据、Grafana配置并展示相关数据。
2 配置
2.1 SpringBoot配置
在SpringBoot中引入actuator组件监控系统信息并对外暴露信息URI,
供调用方查看SpringBoot的相关运行信息,
引入Prometheus组件,生成统计信息,
通过Actuator暴露出Prometheus统计信息的URI,
供Prometheus读取SpringBoot中premetheus组件采集的数据。
配置如下:
- pom.xml
<dependency>
	<groupId>org.springframework.boot</groupId>
	<artifactId>spring-boot-starter-actuator</artifactId>
</dependency>
<dependency>
	<groupId>io.micrometer</groupId>
	<artifactId>micrometer-registry-prometheus</artifactId>
</dependency>
- 1
- 2
- 3
- 4
- 5
- 6
- 7
- 8
- application.yml
作为测试环境,将exposure设置为*,即暴露所有URI,
当然,开发者可以配为其他。
base-path设置为(选配):/api/v1,
因为SpringBoot系统中使用了接口拦截,开放的前缀为/api/v1,
所以,需要这样配置,如果没有配置接口拦截的开发者,可以不设置。
management:
  endpoints:
    web:
      exposure:
        include: '*'
      base-path: /api/v1
- 1
- 2
- 3
- 4
- 5
- 6
- 添加Bean
在启动主函数中添加Bean,
让prometheus组件采集SpringBoot运行时数据,
配置如下:
package com.monkey.tutorial;

import io.micrometer.core.instrument.MeterRegistry;
import org.slf4j.Logger;
import org.slf4j.LoggerFactory;
import org.springframework.boot.SpringApplication;
import org.springframework.boot.actuate.autoconfigure.metrics.MeterRegistryCustomizer;
import org.springframework.boot.autoconfigure.SpringBootApplication;
import org.springframework.boot.web.servlet.ServletComponentScan;
import org.springframework.cache.annotation.EnableCaching;
import org.springframework.cloud.openfeign.EnableFeignClients;
import org.springframework.context.annotation.Bean;
import org.springframework.security.config.annotation.method.configuration.EnableGlobalMethodSecurity;

@SpringBootApplication
@EnableCaching
@EnableFeignClients
@ServletComponentScan
public class TutorialApplication {

	private static final Logger logger = LoggerFactory.getLogger(TutorialApplication.class);

	public static void main(String[] args) {
		SpringApplication.run(TutorialApplication.class, args);
		logger.info("Tutorial 成功启动");
	}

	@Bean
	MeterRegistryCustomizer<MeterRegistry> prometheusConfiguration() {
		return (registry) -> registry.config().commonTags("application", "tutorial");
	}
}

- 1
- 2
- 3
- 4
- 5
- 6
- 7
- 8
- 9
- 10
- 11
- 12
- 13
- 14
- 15
- 16
- 17
- 18
- 19
- 20
- 21
- 22
- 23
- 24
- 25
- 26
- 27
- 28
- 29
- 30
- 31
- 32
2.2 Prometheus配置
Prometheus数据采集,配置数据采集间隔、SpringBoot服务IP:PORT、采集信息的URI,
配置如下:
global:
  scrape_interval: 10s # 每10秒采集一次数据
  evaluation_interval: 10s # 每10秒检测一次告警

scrape_configs:
  - job_name: current_system
    static_configs:
      - targets: ['192.168.211.129:9100']
        labels:
          instance: system
  - job_name: app_tutorial # 任务名称
    metrics_path: '/api/v1/prometheus' # 后台通过actuator暴露的URI
    static_configs:
      - targets: ['192.168.211.1:9121'] # 后台IP和PORT
        labels:
          instance: springboot # 实例名称
- 1
- 2
- 3
- 4
- 5
- 6
- 7
- 8
- 9
- 10
- 11
- 12
- 13
- 14
- 15
- 16
- 启动
这里不配置采集数据持久化,只挂载配置文件。
sudo docker run -d -p 9090:9090 -v /home/xindaqi/software/install/prometheus/config.yml:/etc/prometheus/prometheus.yml prom/prometheus
- 1
3 监控
3.1 SpringBoot监控数据
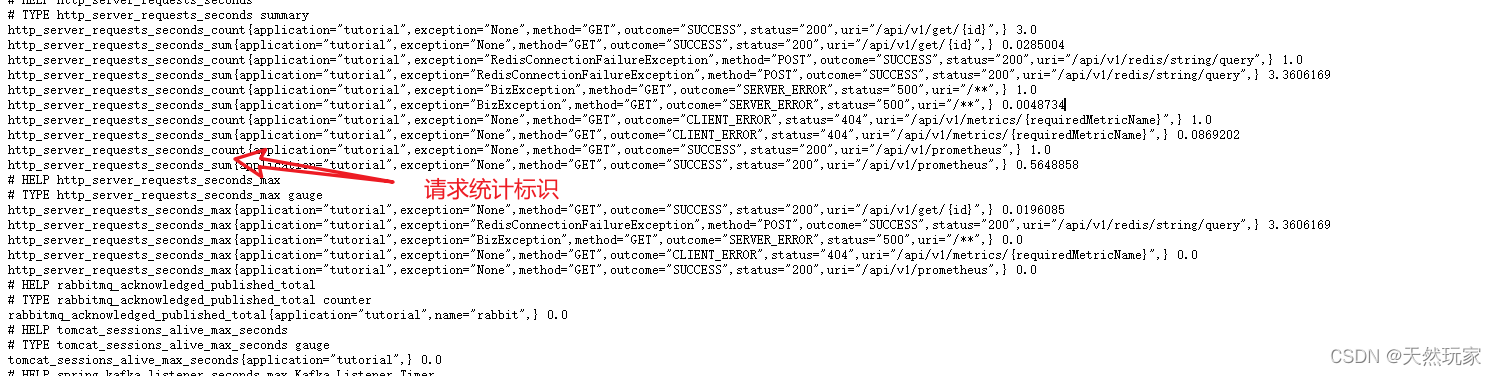
启动后台该服务,生成的数据接口:
http://localhost:9121/api/v1/prometheus
数据统计标识:
| 序号 | 标识 | 描述 |
|---|---|---|
| 1 | http_server_requests_seconds_count | 请求量 |
| 2 | http_server_requests_seconds_sum | 请求总耗时 |
| 3 | http_server_requests_seconds_max | 请求最大耗时 |
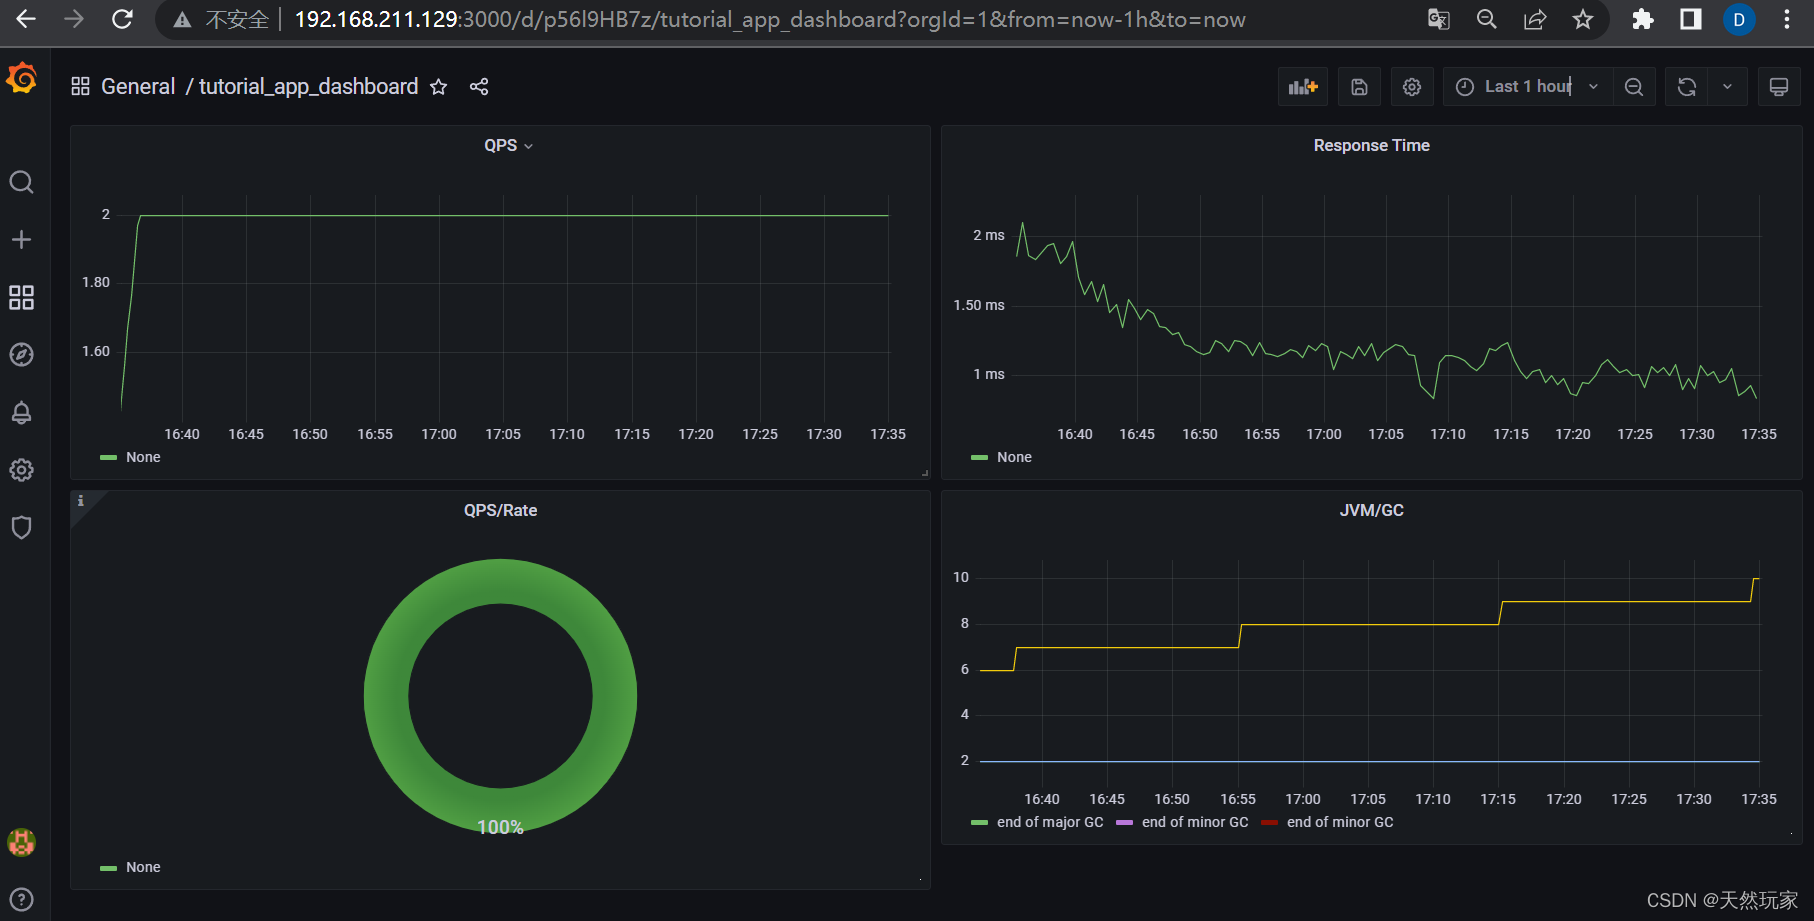
3.2 Grafana监控仪表板
Grafana连接Prometheus参考:
合集:Ubuntu20部署Prometheus和Grafana
配置Grafana最终的效果如下图所示。
4 Grafana监控配置
在Grafana中配置监控指标。
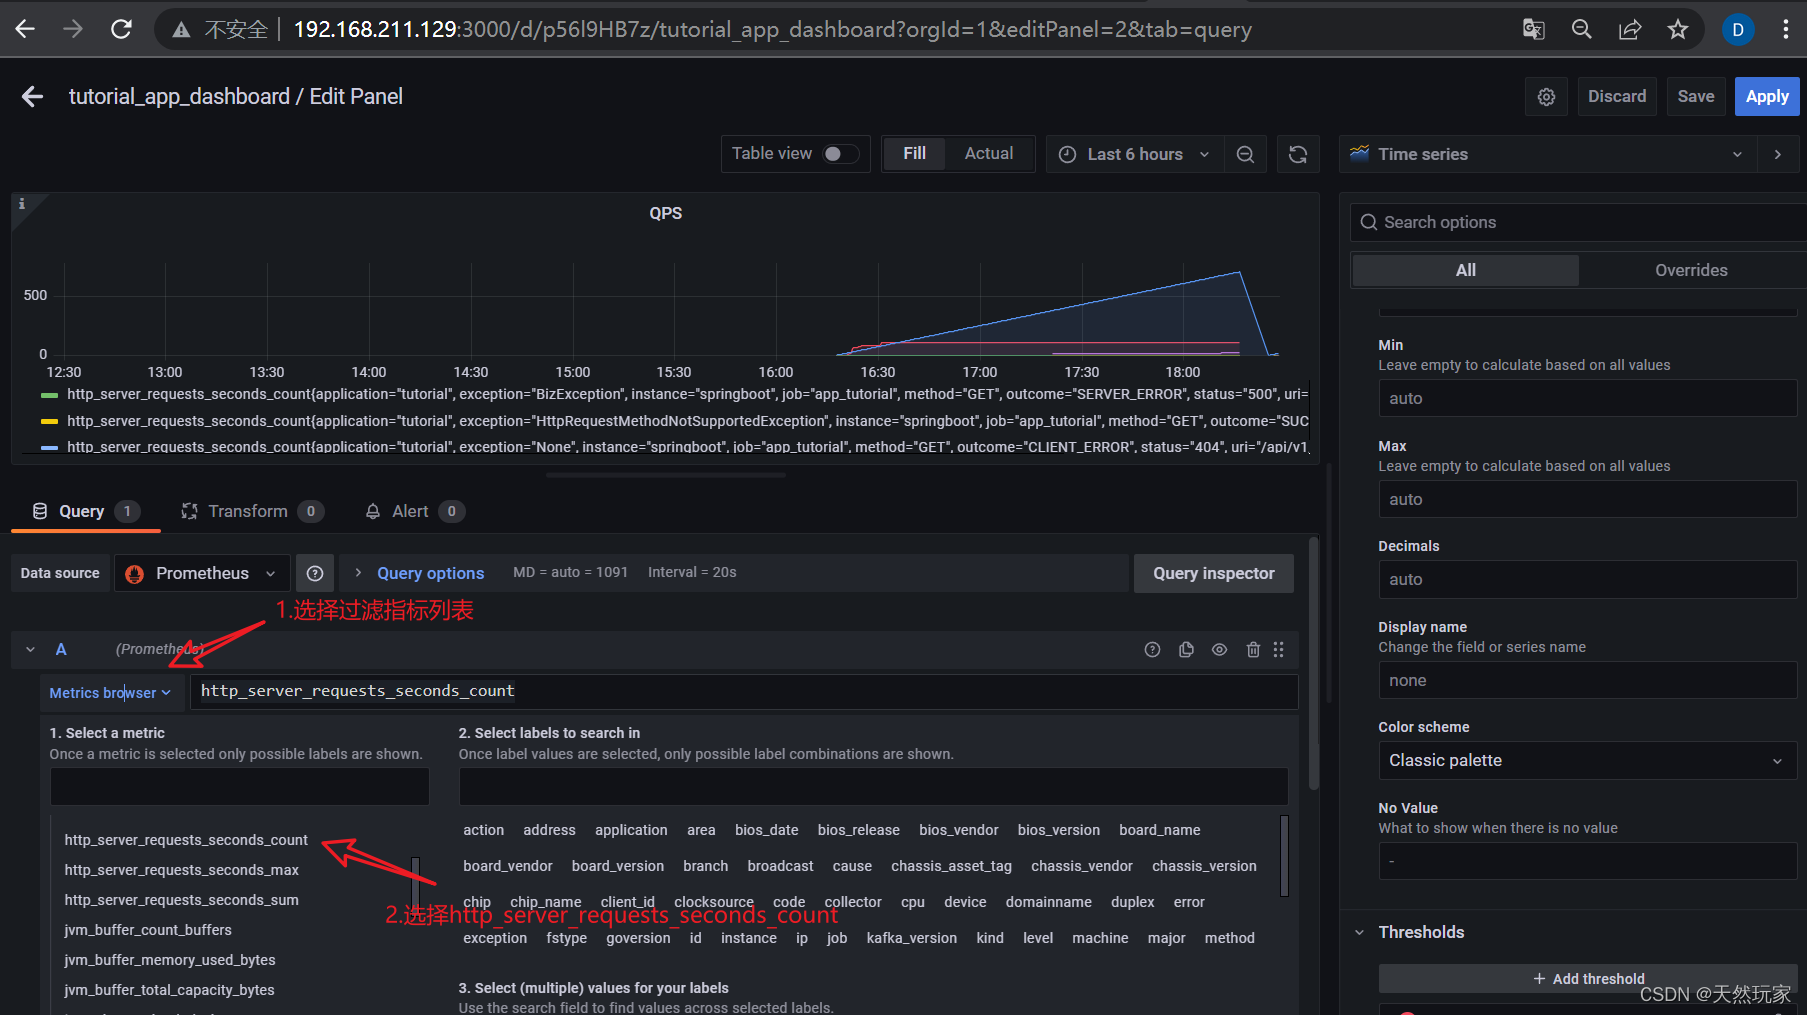
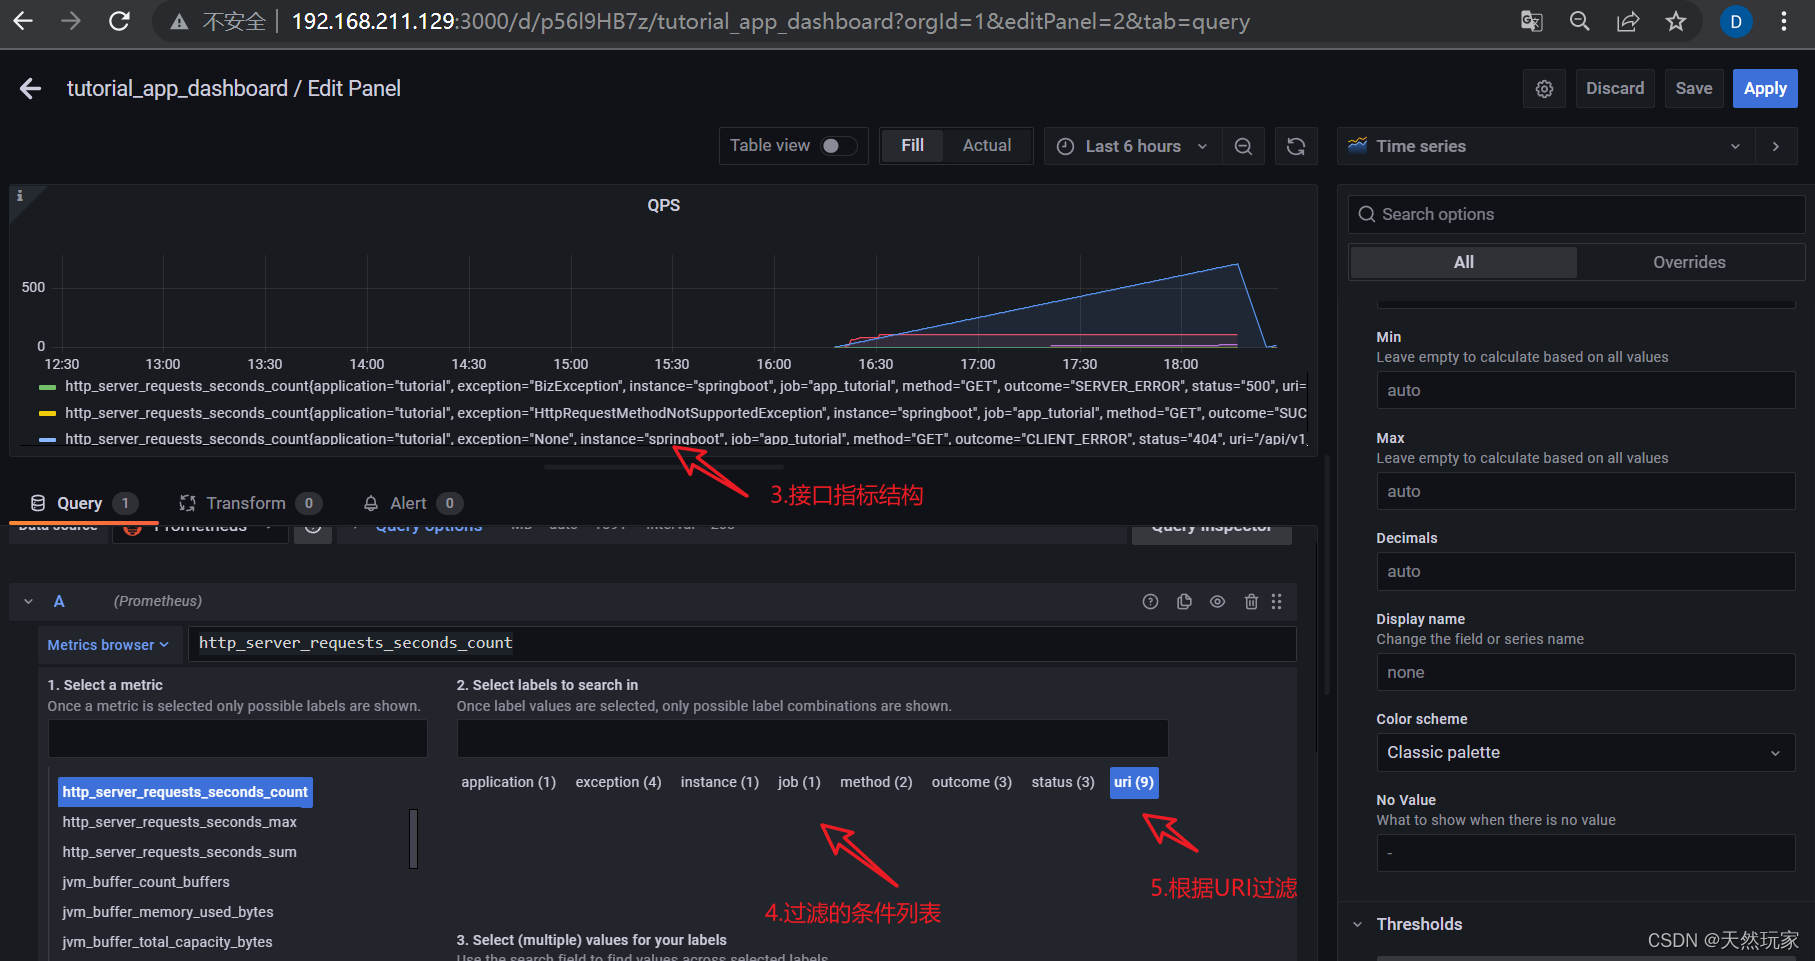
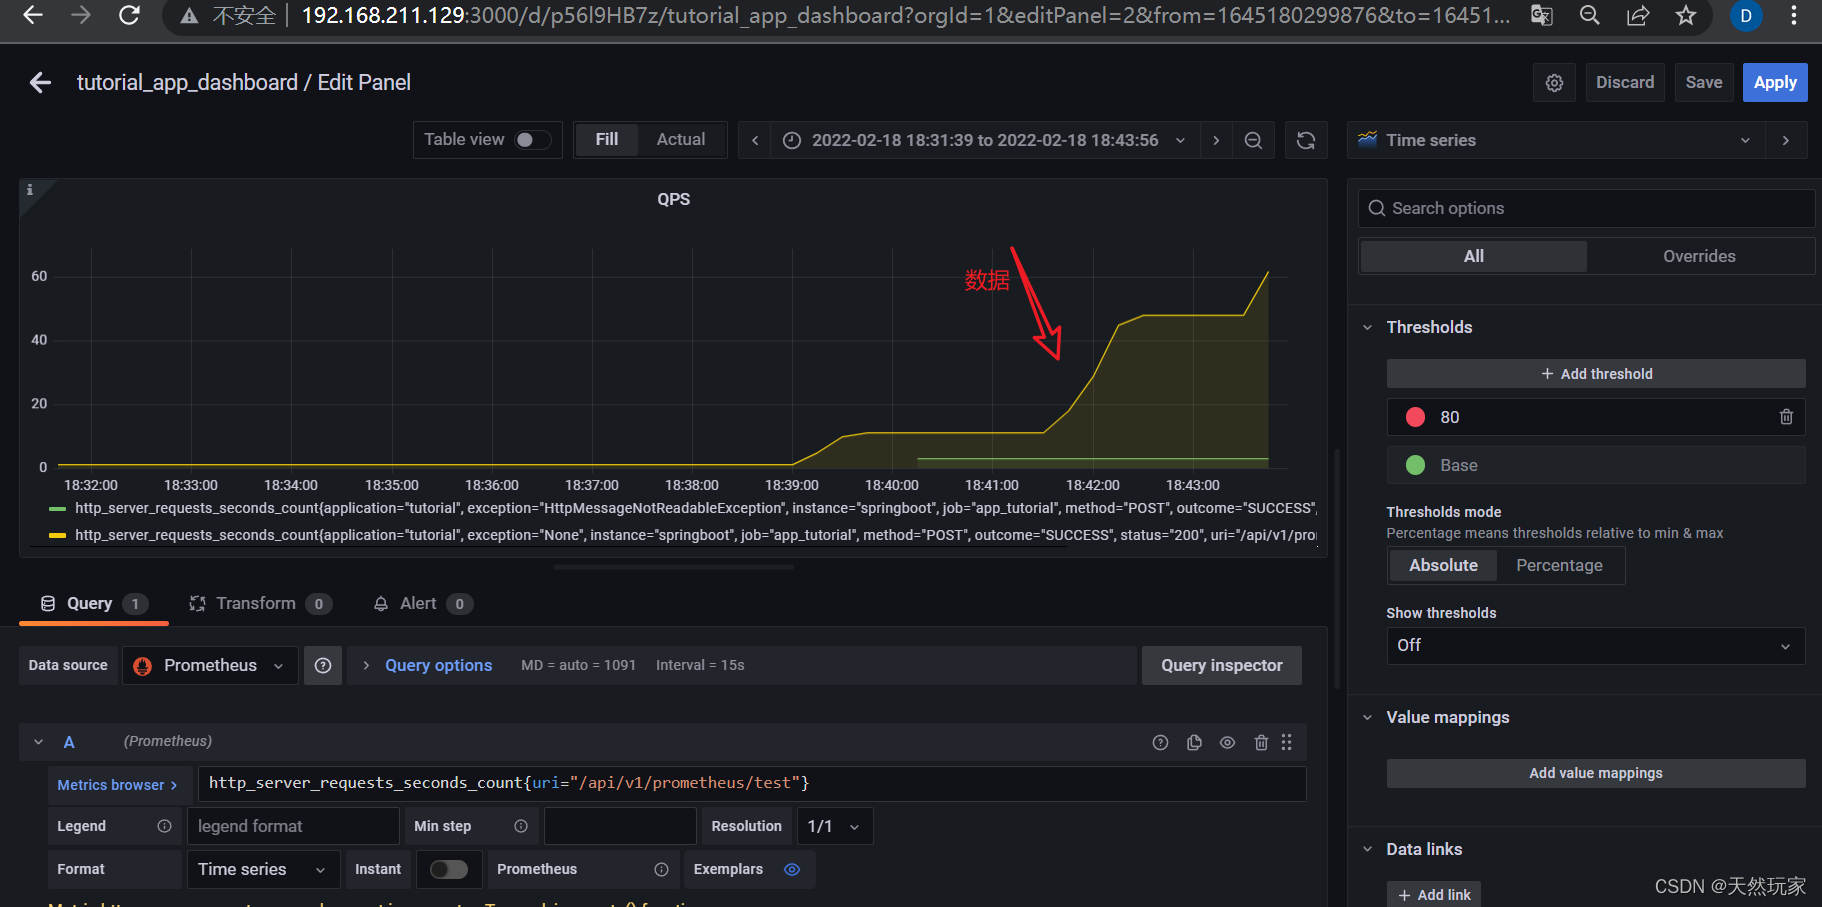
4.1 QPS配置
表达式:
rate(http_server_requests_seconds_count{uri="/api/v1/prometheus/test"}[5m])
- 1
- 配置监控属性
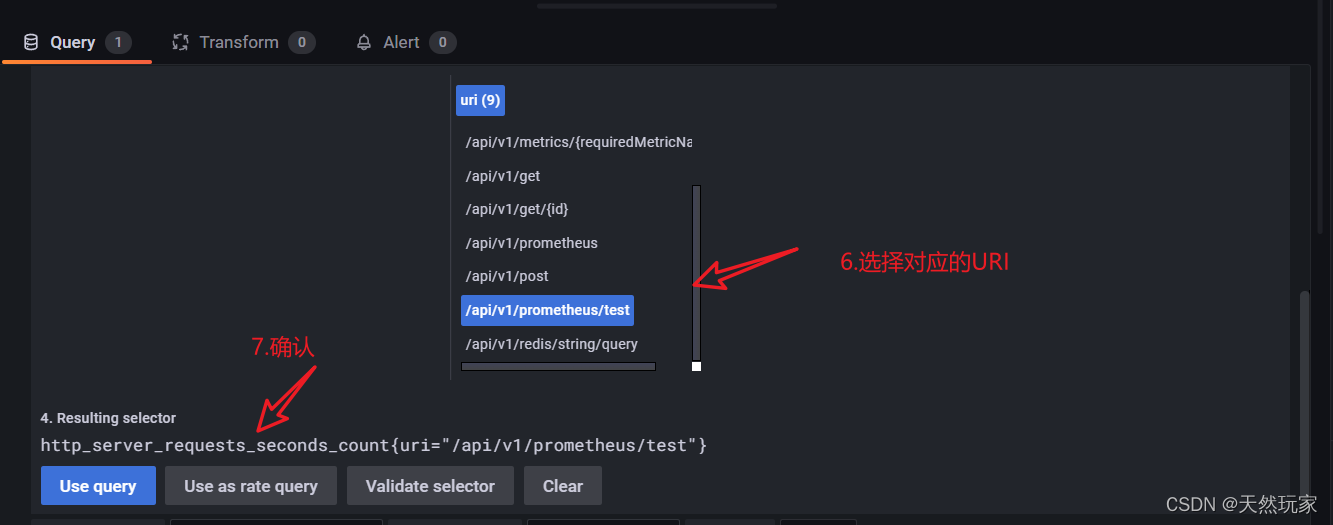
- 数据显示
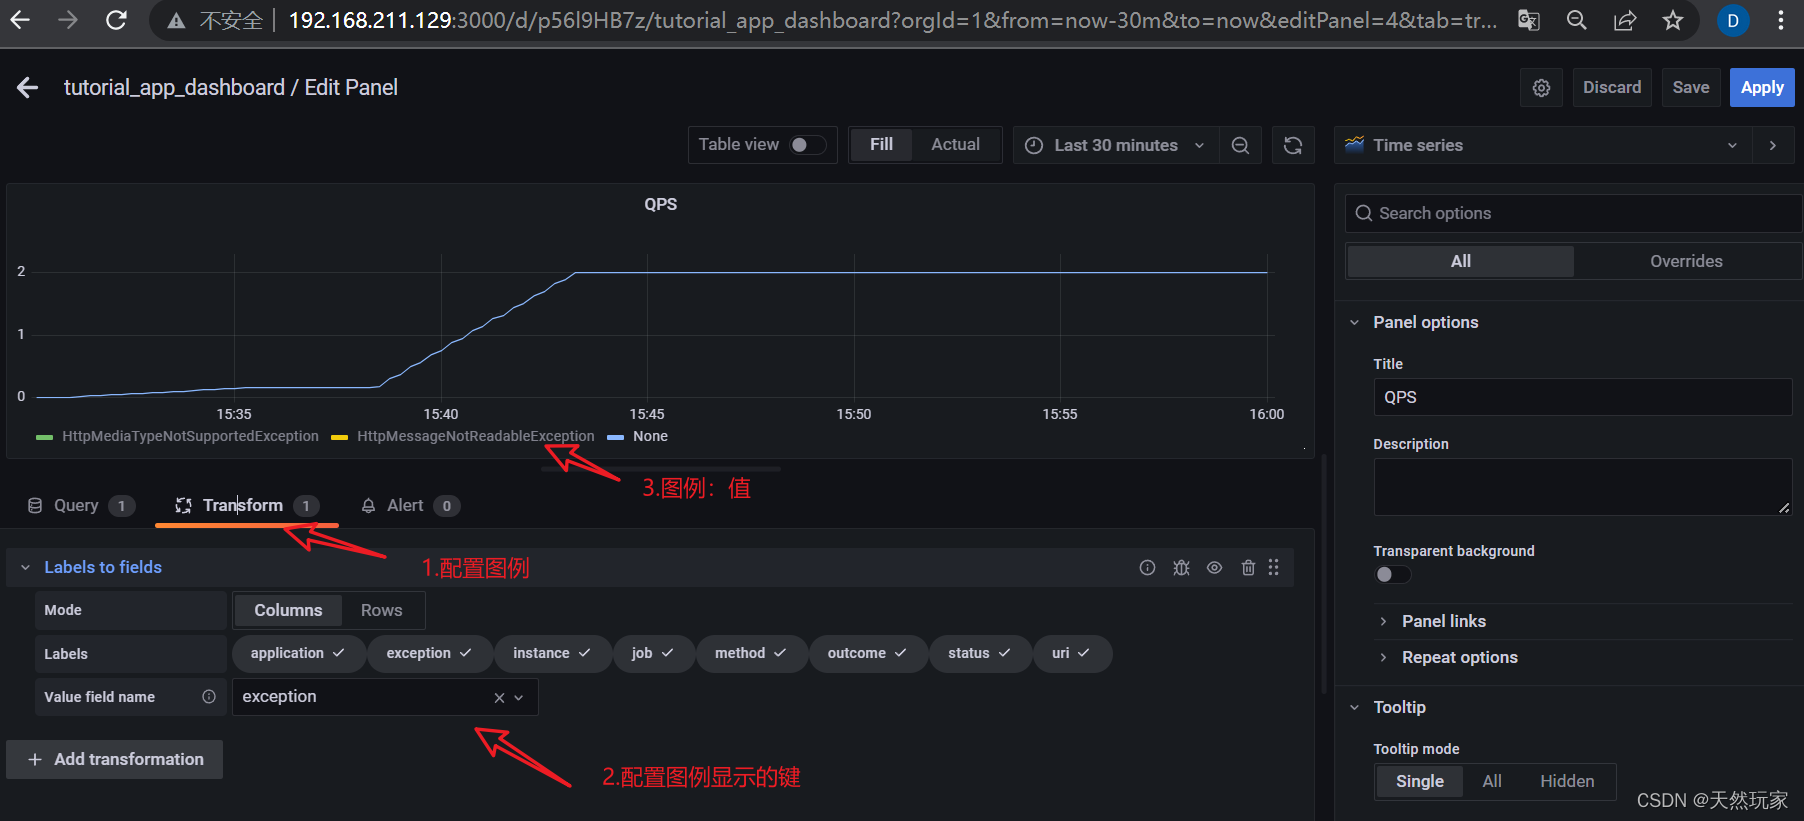
- 配置图例
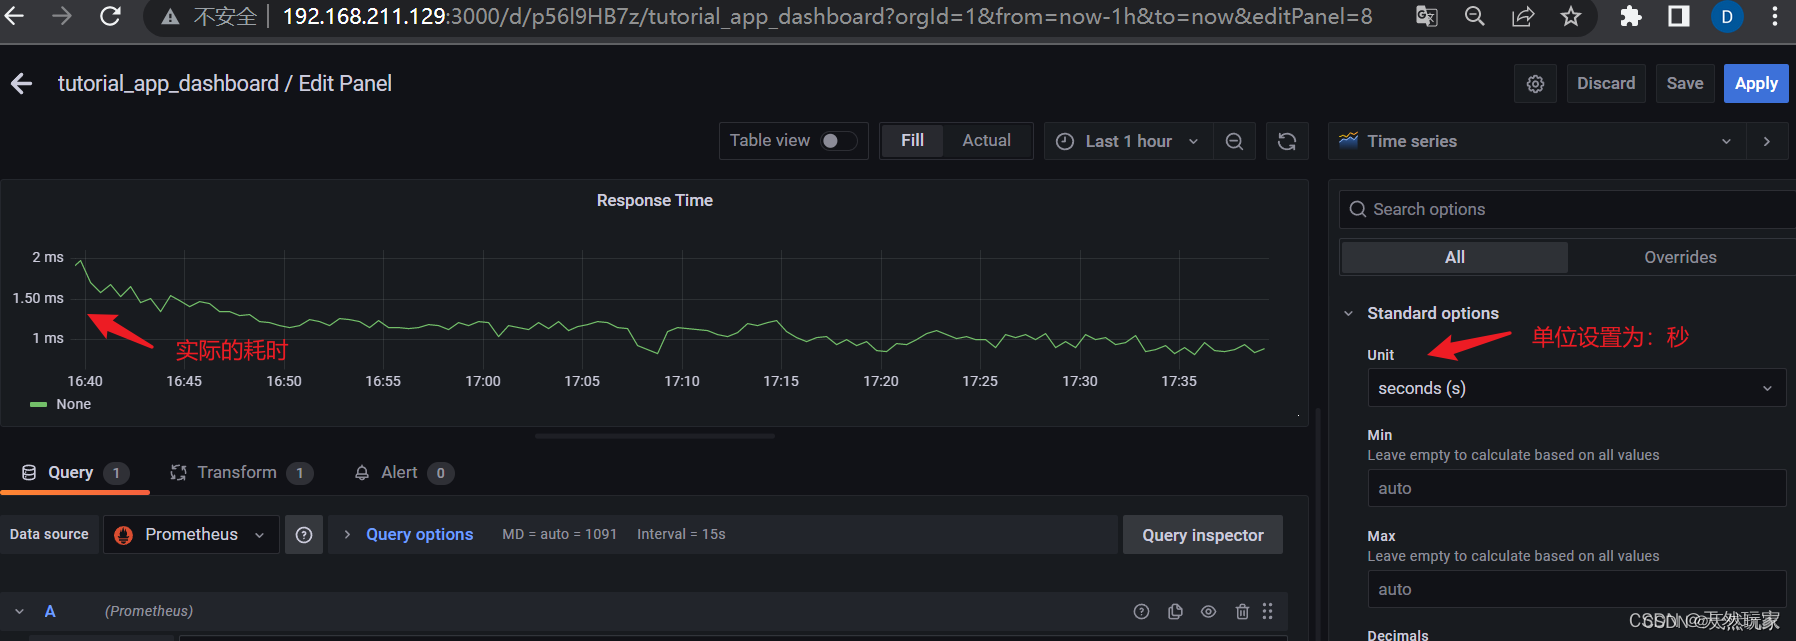
4.2 接口耗时配置
计算公式:
接
口
耗
时
=
单
位
时
间
内
总
耗
时
单
位
时
间
内
请
求
数
量
接口耗时=\frac{{单位时间内总耗时}}{{单位时间内请求数量}}
接口耗时=单位时间内请求数量单位时间内总耗时
Grafana表达式:
rate(http_server_requests_seconds_sum{uri="/api/v1/prometheus/test"}[1m])/rate(http_server_requests_seconds_count{uri="/api/v1/prometheus/test"}[1m])
- 1
其余和QPS配置方式一致,单位选择秒,参考配置如下图:
4.3 JVM垃圾回收配置
Metrics browser中选择jvm_gc_pause_seconds_count,其余和QPS配置方式一致。
Grafana表达式:
jvm_gc_pause_seconds_count{action=~"end of major GC|end of minor GC",job="app_tutorial"}
- 1
5 小结
要点:
- SpringBoot添加actuator和prometheus依赖,actuator暴露监听数据URI,prometheus采集并统计数据;
- SpringBoot中配置prometheus数据采集Bean;
- Prometheus启动文件中添加监控的后台服务信息,如数据采集间隔、服务IP:PROT等;
- Grafana配置:Metrics browser配置监控的指标:包括uri、outcome等等;
- Transform配置数据转换:Labels to fields配置图例名称。


