
热门标签
热门文章
- 1解决ADB错误“more than one device and emulator”_error: more than one device and emulator
- 2大模型基础应用框架创新及其在零售业务中的落地实践
- 3window7系统电脑,如何调亮度
- 4【JAVA项目】基于SSM+HTML5的【网上跳蚤市场】
- 5电脑网络连接正常,但浏览器无法打开网页的原因和解决方法_电脑应用可以访问网络而浏览器无法访问网络是为什么
- 6springboot整合sse_springboot sse
- 7基础pytorch安装gpu版本--保姆级教程_torch-1.6.0+cu102
- 8适合开发人员看的鸿蒙OS介绍~
- 9matlab多变量优化,matlab - Matlab使用fminsearch优化多变量 - 堆栈内存溢出
- 10【Vite基础】004-Vite 中处理静态资源_vite统一静态资源地址
当前位置: article > 正文
关于Echarts图标的tooltip配置中的formatter_echarts line tooltip formatter
作者:繁依Fanyi0 | 2024-03-25 09:38:33
赞
踩
echarts line tooltip formatter
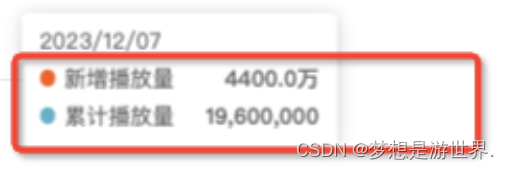
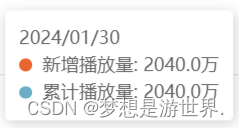
使用tooltip的formatter进行格式化,格式化前效果如上图,一个是数字,一个是xxx万,不符合设计,需要统一,期望效果是这样
需要先了解formatter
格式化的类型有两种,一是字符串模板,二是自定义模板
字符串模板:
模板变量有 {a}, {b},{c},{d},{e},分别表示系列名,数据名,数据值等。 在 trigger 为 ‘axis’ 的时候,会有多个系列的数据,此时可以通过 {a0}, {a1}, {a2} 这种后面加索引的方式表示系列的索引。 不同图表类型下的 {a},{b},{c},{d} 含义不一样。 其中变量{a}, {b}, {c}, {d}在不同图表类型下代表数据含义为:
- 折线(区域)图、柱状(条形)图、K线图 : {a}(系列名称),{b}(类目值),{c}(数值), {d}(无)
- 散点图(气泡)图 : {a}(系列名称),{b}(数据名称),{c}(数值数组), {d}(无)
- 地图 : {a}(系列名称),{b}(区域名称),{c}(合并数值), {d}(无)
- 饼图、仪表盘、漏斗图: {a}(系列名称),{b}(数据项名称),{c}(数值), {d}(百分比)
示例
formatter: '{b0}: {c0}'
自定义函数(回调函数):
回调函数格式:
(params: Object|Array, ticket: string, callback: (ticket: string, html: string)) => string
这里字符串模板不太方便实现,所以使用自定义模板
自定义函数的第一个参数params是formatter需要的数据集
包含以下内容
- {
- componentType: 'series',
- // 系列类型
- seriesType: string,
- // 系列在传入的 option.series 中的 index
- seriesIndex: number,
- // 系列名称
- seriesName: string,
- // 数据名,类目名
- name: string,
- // 数据在传入的 data 数组中的 index
- dataIndex: number,
- // 传入的原始数据项
- data: Object,
- // 传入的数据值
- value: number|Array,
- // 数据图形的颜色
- color: string,
- // 饼图的百分比
- percent: number,
- }
在 trigger 为 ‘axis’ 的时候,或者 tooltip 被 axisPointer 触发的时候,params 是多个系列的数据数组
- {
- componentType: 'series',
- // 系列类型
- seriesType: string,
- // 系列在传入的 option.series 中的 index
- seriesIndex: number,
- // 系列名称
- seriesName: string,
- // 数据名,类目名
- name: string,
- // 数据在传入的 data 数组中的 index
- dataIndex: number,
- // 传入的原始数据项
- data: Object,
- // 传入的数据值。在多数系列下它和 data 相同。在一些系列下是 data 中的分量(如 map、radar 中)
- value: number|Array|Object,
- // 坐标轴 encode 映射信息,
- // key 为坐标轴(如 'x' 'y' 'radius' 'angle' 等)
- // value 必然为数组,不会为 null/undefied,表示 dimension index 。
- // 其内容如:
- // {
- // x: [2] // dimension index 为 2 的数据映射到 x 轴
- // y: [0] // dimension index 为 0 的数据映射到 y 轴
- // }
- encode: Object,
- // 维度名列表
- dimensionNames: Array<String>,
- // 数据的维度 index,如 0 或 1 或 2 ...
- // 仅在雷达图中使用。
- dimensionIndex: number,
- // 数据图形的颜色
- color: string,
-
- }
第二个参数 ticket 是异步回调标识,配合第三个参数 callback 使用。
第三个参数 callback 是异步回调.
在提示框浮层内容是异步获取的时候,可以通过 callback 传入上述的 ticket 和 html 更新提示框浮层内容。
示例
- formatter: function (params, ticket, callback) {
- $.get('detail?name=' + params.name, function (content) {
- callback(ticket, toHTML(content));
- });
- return 'Loading';
- }
最后是实现代码
formatNumber是自己写的通用格式化函数
- option = {
- title: {
- text: '',
- },
- color: '',
- tooltip: {
- trigger: 'axis',//触发类型 [item,axis,none] item"数据项图形触发,主要在散点图,饼图等无类目轴的图表。'axis'坐标轴触发,主要在柱状图,折线图等会使用类目轴的图表
- axisPointer: {
- type: 'cross',//line 直线指示器 shadow 阴影指示器 none 无指示器 cross 十字准星指示器
- },
- formatter: function (params: any) {
- let result = params[0].name + '<br>' // 获取横轴对应的数据作为提示信息的标题
- params.forEach(function (item: any) {
- if (item.seriesType === 'line') {
- result += item.marker + ' ' + item.seriesName + ': ' + formatNumber(item.value) + '<br>' // 对折线图数据进行格式化
- } else if (item.seriesType === 'bar') {
- result += item.marker + ' ' + item.seriesName + ': ' + formatNumber(item.value) + ' <br>' // 对柱状图数据进行格式化
- }
- })
- return result
- },
- },
- grid: {},
- legend: {data: [a,b]},
- xAxis: [],
- yAxis: [],
- series: [],
- }
声明:本文内容由网友自发贡献,不代表【wpsshop博客】立场,版权归原作者所有,本站不承担相应法律责任。如您发现有侵权的内容,请联系我们。转载请注明出处:https://www.wpsshop.cn/w/繁依Fanyi0/article/detail/308675
推荐阅读
相关标签

