
- 1Python之字符串的134个常用操作_abab4546
- 2SpringBoot常见面试题汇总(超详细回答)_springboot面试
- 3Kafka Connect Datagen 创建测试数据生成器_kafka测试数据生成
- 4rbpf粒子滤波slam matlab程序_水下SLAM初探
- 5F5 配置负载均衡_f5admin2
- 6node相关
- 7Axure9 生成的HTML在浏览器中打不开_axure生成的html文件打开后交互不了
- 8Doris系列3-基础使用指南_doris 设置密码
- 9如何在Powershell中使用Get-Service命令检查Windows服务状态
- 10十款开源的数据库管理工具_数据库管理工具 开元
【Python】pyecharts 模块 ① ( ECharts 简介 | pyecharts 简介 | pyecharts 中文网站 | pyecharts 画廊网站 | pyecharts 画 )
赞
踩
pyecharts 画廊网站 : https://gallery.pyecharts.org/#/
一、pyecharts 模块
1、ECharts 简介
ECharts 官方网站 : https://echarts.apache.org/zh/index.html
ECharts 是 百度 提供的 基于 JavaScript 的开源可视化库 , 可以借助该 函数库 绘制 精美的 图表 ;
ECharts 支持多种图表类型 , 包括折线图、柱状图、散点图、饼图、雷达图、地图等 , 并且可以根据需求进行自定义配置 ;
它还支持动态数据更新、交互操作、动画效果等功能,可以让用户更加直观地理解和分析数据。
2、pyecharts 简介
pyecharts 官方网站 : https://pyecharts.org/#/

pyecharts 模块 是 生成 Echarts 图表的 Python 类库 , 该模块 提供了简单易用的 API , 可以让开发者通过 Python 代码快速生成各种类型的 Echarts 图表 , 包括折线图、柱状图、散点图、饼图、雷达图等 ;
借助 pyecharts 模块 提供的 API 可以实现图表的各种配置选项 , 包括 全局配置选项 和 系列配置选项 ;
pyecharts 模块 还支持动态数据更新、交互操作、动画效果等功能 , 可以让用户更加直观地理解和分析数据 ;
在命令行中 , 执行
pip install pyecharts
- 1
命令 , 即可安装 pyecharts 模块 ;
3、pyecharts 中文网站
在 pyecharts 官网 https://pyecharts.org/#/ 主页中 , 点击右上角的 Language , 选择下拉菜单中的中文 选项 ;
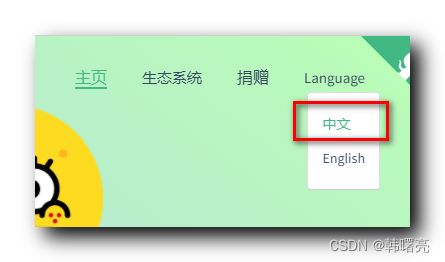
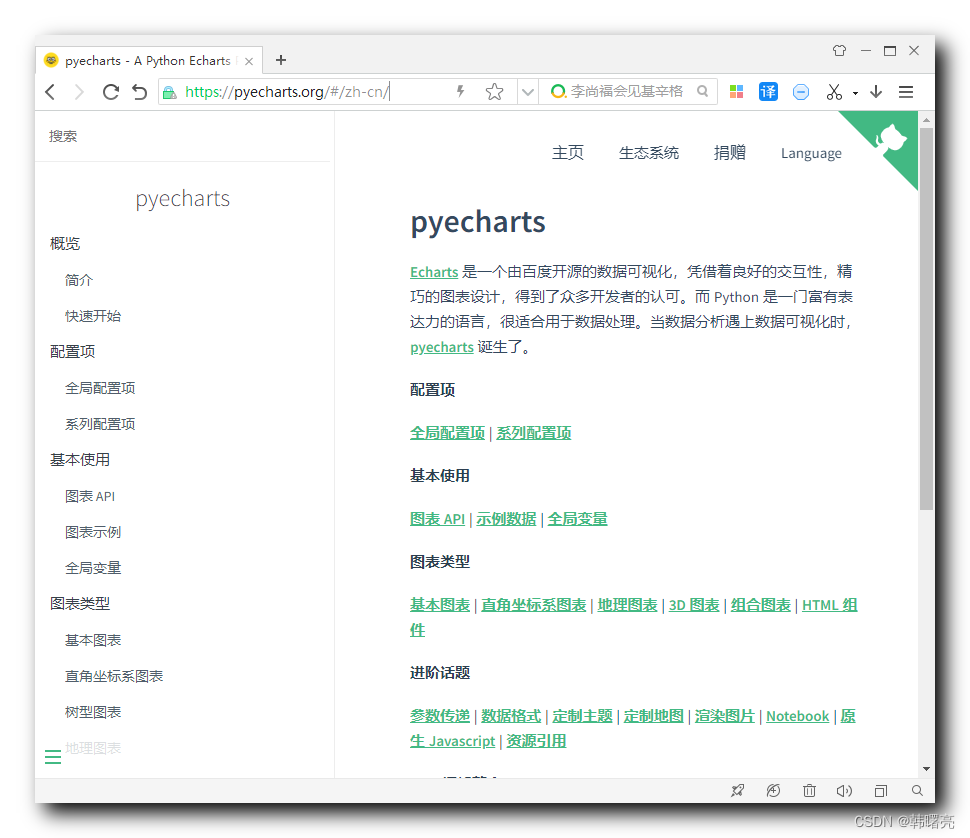
可跳转到 pyecharts 中文网站 : https://pyecharts.org/#/zh-cn/
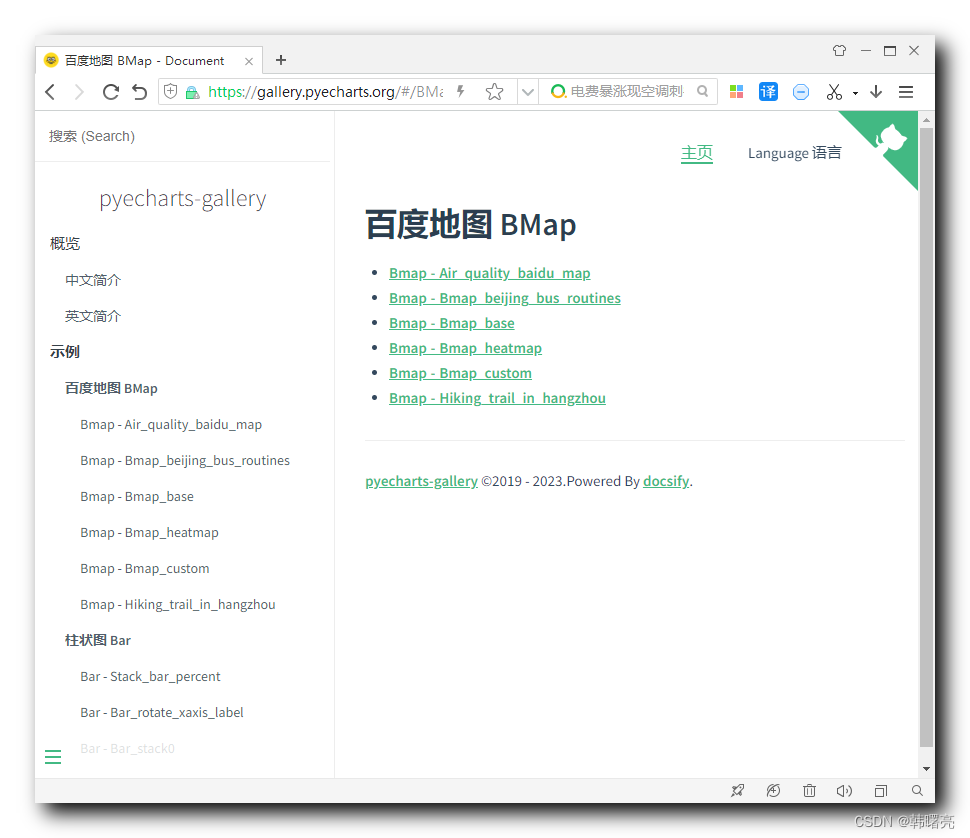
4、pyecharts 画廊网站
由于 pyecharts 模块有很强大的功能 , 官方为每种功能都提供了案例 , 这些案例都在 pyecharts 画廊网站 ;
pyecharts 画廊网站 : https://gallery.pyecharts.org/#/
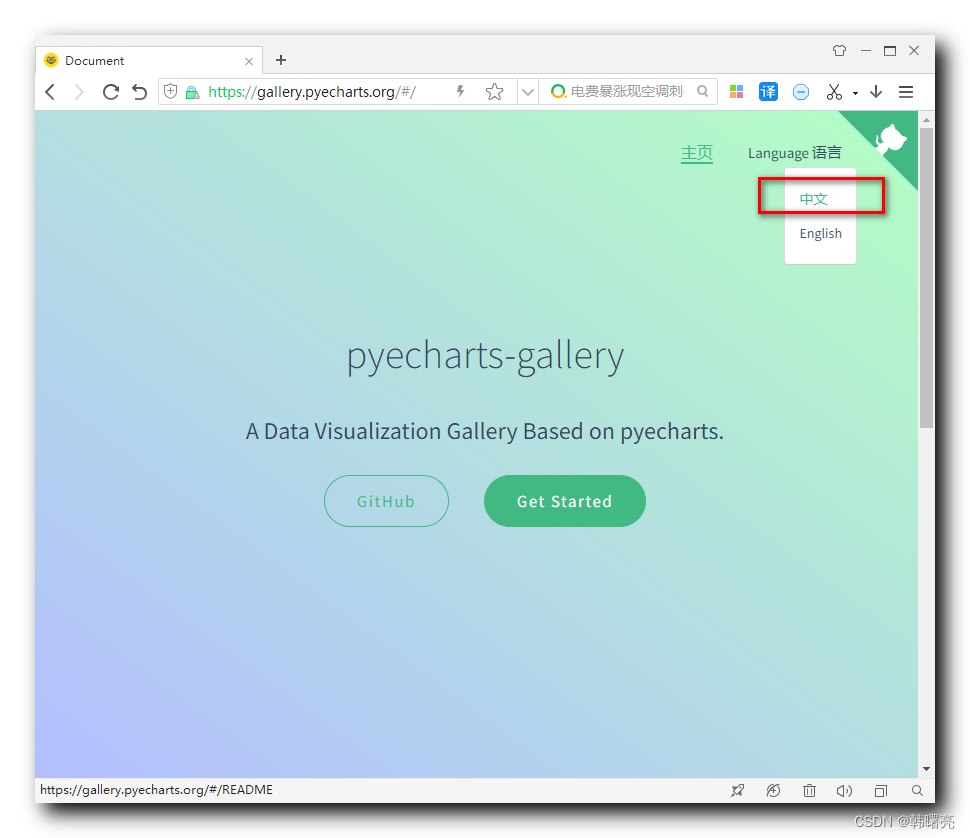
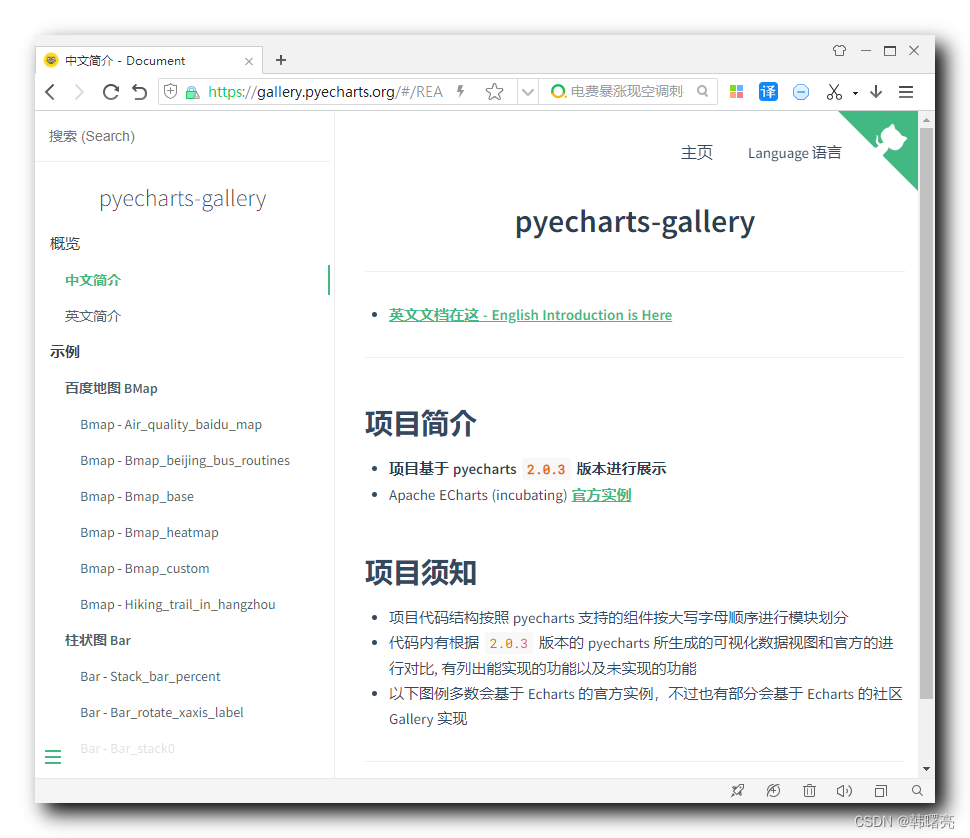
在上述页面中 , 选择中文语言 , 就可以进入中文站 https://gallery.pyecharts.org/#/README ;
其中有各种示例 ;
比如 , 百度地图提供了如下功能 :
上面的部分是 Python 代码 :
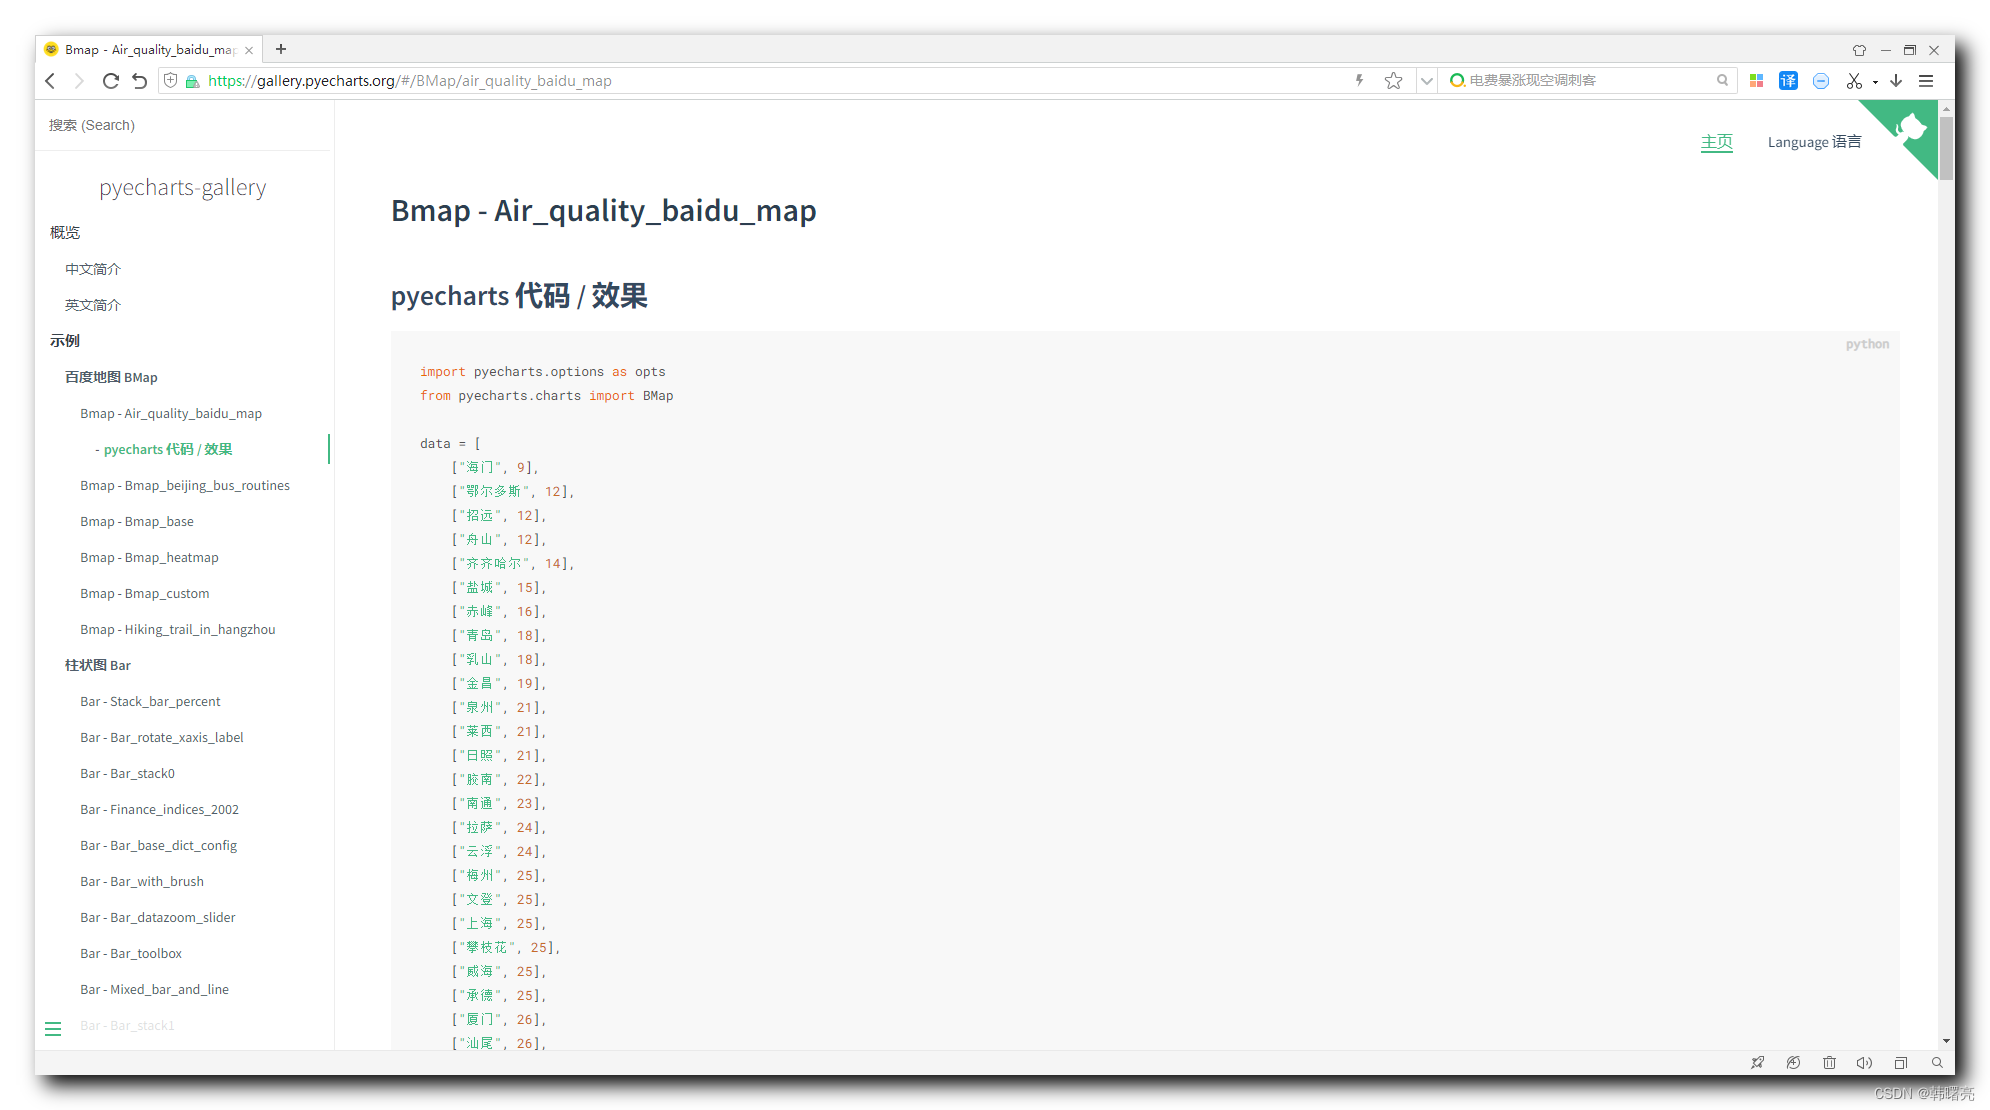
这里列举下代码内容 :
import pyecharts.options as opts
from pyecharts.charts import BMap

data = [
    ["海门", 9],
    ["鄂尔多斯", 12],
    ["招远", 12],
]

geoCoordMap = {
    "海门": [121.15, 31.89],
    "鄂尔多斯": [109.781327, 39.608266],
    "招远": [120.38, 37.35],

}


def convert_data():
    res = []
    for i in range(len(data)):
        geo_coord = geoCoordMap[data[i][0]]
        geo_coord.append(data[i][1])
        res.append([data[i][0], geo_coord])
    return res


(
    BMap(init_opts=opts.InitOpts(width="1200px", height="800px"))
    .add(
        type_="effectScatter",
        series_name="pm2.5",
        data_pair=convert_data(),
        symbol_size=10,
        effect_opts=opts.EffectOpts(),
        label_opts=opts.LabelOpts(formatter="{b}", position="right", is_show=False),
        itemstyle_opts=opts.ItemStyleOpts(color="purple"),
    )
    .add_schema(
        baidu_ak="FAKE_AK",
        center=[104.114129, 37.550339],
        zoom=5,
        is_roam=True,
        map_style={
            "styleJson": [
                {
                    "featureType": "water",
                    "elementType": "all",
                    "stylers": {"color": "#044161"},
                },
                {
                    "featureType": "land",
                    "elementType": "all",
                    "stylers": {"color": "#004981"},
                },
                {
                    "featureType": "boundary",
                    "elementType": "geometry",
                    "stylers": {"color": "#064f85"},
                },
                {
                    "featureType": "railway",
                    "elementType": "all",
                    "stylers": {"visibility": "off"},
                },
                {
                    "featureType": "highway",
                    "elementType": "geometry",
                    "stylers": {"color": "#004981"},
                },
                {
                    "featureType": "highway",
                    "elementType": "geometry.fill",
                    "stylers": {"color": "#005b96", "lightness": 1},
                },
                {
                    "featureType": "highway",
                    "elementType": "labels",
                    "stylers": {"visibility": "off"},
                },
                {
                    "featureType": "arterial",
                    "elementType": "geometry",
                    "stylers": {"color": "#004981"},
                },
                {
                    "featureType": "arterial",
                    "elementType": "geometry.fill",
                    "stylers": {"color": "#00508b"},
                },
                {
                    "featureType": "poi",
                    "elementType": "all",
                    "stylers": {"visibility": "off"},
                },
                {
                    "featureType": "green",
                    "elementType": "all",
                    "stylers": {"color": "#056197", "visibility": "off"},
                },
                {
                    "featureType": "subway",
                    "elementType": "all",
                    "stylers": {"visibility": "off"},
                },
                {
                    "featureType": "manmade",
                    "elementType": "all",
                    "stylers": {"visibility": "off"},
                },
                {
                    "featureType": "local",
                    "elementType": "all",
                    "stylers": {"visibility": "off"},
                },
                {
                    "featureType": "arterial",
                    "elementType": "labels",
                    "stylers": {"visibility": "off"},
                },
                {
                    "featureType": "boundary",
                    "elementType": "geometry.fill",
                    "stylers": {"color": "#029fd4"},
                },
                {
                    "featureType": "building",
                    "elementType": "all",
                    "stylers": {"color": "#1a5787"},
                },
                {
                    "featureType": "label",
                    "elementType": "all",
                    "stylers": {"visibility": "off"},
                },
            ]
        },
    )
    .set_global_opts(
        title_opts=opts.TitleOpts(
            title="全国主要城市空气质量",
            subtitle="data from PM25.in",
            subtitle_link="http://www.pm25.in",
            pos_left="center",
            title_textstyle_opts=opts.TextStyleOpts(color="#fff"),
        ),
        tooltip_opts=opts.TooltipOpts(trigger="item"),
    )
    .render("air_quality_baidu_map.html")
)

- 1
- 2
- 3
- 4
- 5
- 6
- 7
- 8
- 9
- 10
- 11
- 12
- 13
- 14
- 15
- 16
- 17
- 18
- 19
- 20
- 21
- 22
- 23
- 24
- 25
- 26
- 27
- 28
- 29
- 30
- 31
- 32
- 33
- 34
- 35
- 36
- 37
- 38
- 39
- 40
- 41
- 42
- 43
- 44
- 45
- 46
- 47
- 48
- 49
- 50
- 51
- 52
- 53
- 54
- 55
- 56
- 57
- 58
- 59
- 60
- 61
- 62
- 63
- 64
- 65
- 66
- 67
- 68
- 69
- 70
- 71
- 72
- 73
- 74
- 75
- 76
- 77
- 78
- 79
- 80
- 81
- 82
- 83
- 84
- 85
- 86
- 87
- 88
- 89
- 90
- 91
- 92
- 93
- 94
- 95
- 96
- 97
- 98
- 99
- 100
- 101
- 102
- 103
- 104
- 105
- 106
- 107
- 108
- 109
- 110
- 111
- 112
- 113
- 114
- 115
- 116
- 117
- 118
- 119
- 120
- 121
- 122
- 123
- 124
- 125
- 126
- 127
- 128
- 129
- 130
- 131
- 132
- 133
- 134
- 135
- 136
- 137
- 138
- 139
- 140
- 141
- 142
- 143
- 144
- 145
- 146
- 147
- 148
- 149
- 150
最下面是代码效果 :

5、pyecharts 画廊用法
如果想要绘制相同的代码 , 只需要拷贝对应的 Python 代码 , 然后把其中的数据换一下 , 就可以实现对应的功能 ;


