
热门标签
热门文章
- 1L1-6 剪切粘贴(Python)
- 2Caused by: java.lang.IllegalStateException: Expected BEGIN_OBJECT but was STRING at line 1 column 39...
- 3如何提升C++ 代码性能-以loop为例
- 4脑电分析系列[MNE-Python-2]| MNE中数据结构Epoch及其创建方法
- 5海思越影3516DV500效果对比,升级版越影1.1版本有大幅提升_tnr snr
- 6Tested采访扎克伯格:揭秘四款VR原型机更多细节_青亭网 meta pancake
- 7【Oracle笔记】数据库dump导入和导出_oracle dba_hist_datadump
- 8单阶段多层检测器:SSD (理论及Pytorch代码详解)
- 9【JavaSE】Java练习—方法 _Java SE_public static void main(string[] args) { scanner a
- 10微信小程序个人中心页面开发_个人中心微信小程序代码
当前位置: article > 正文
GEE实现图像随机森林分类_gee:随机森林分类教程(样本制作、特征添加、训练、精度、参数优化、贡献度、统计
作者:笔触狂放9 | 2024-03-15 06:02:33
赞
踩
gee:随机森林分类教程(样本制作、特征添加、训练、精度、参数优化、贡献度、统计
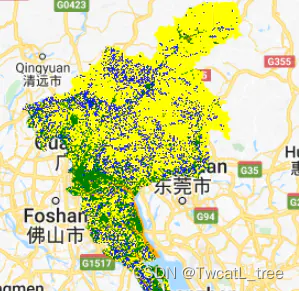
对图像进行土地利用分类,因此下面是监督分类的流程以及代码案例。
1.首先分类最开始应该建立样本数据集,在这里我分了四类,然后就开始自己的采样,设立好分类后,对目标进行分类。
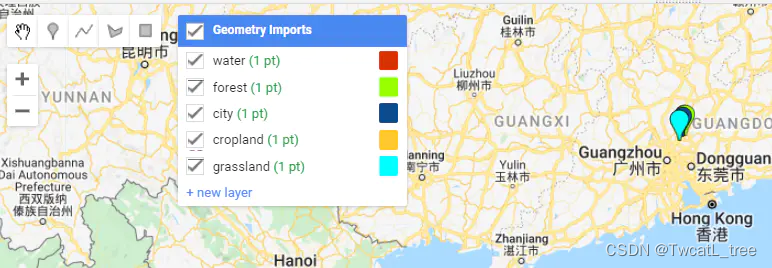
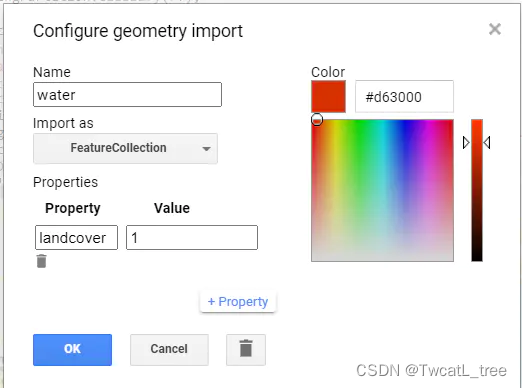
然后对每个样本进行颜色选择和属性定义
//选择需要裁剪的矢量数据
var aoi = ee.FeatureCollection("users/yangyao19960805/NewFolder");
//加载矢量边框,以便于在边界内选取样本点
var empty = ee.Image().toByte();
var outline = empty.paint({
 featureCollection:aoi, // 行政边界命名为fc
 color:0, //颜色透明
 width:3 //边界宽度
});
Map.addLayer(outline, {palette: "ff0000"}, "outline");
//Function to mask the clouds in Sentinel-2
function maskS2clouds(image) {
  var qa = image.select('QA60');

  // Bits 10 and 11 are clouds and cirrus, respectively.
  var cloudBitMask = 1 << 10;
  var cirrusBitMask = 1 << 11;

  // Both flags should be set to zero, indicating clear conditions.
  var mask = qa.bitwiseAnd(cloudBitMask).eq(0)
      .and(qa.bitwiseAnd(cirrusBitMask).eq(0));

  return image.updateMask(mask).divide(10000);
}

//Build the Sentinel 2 collection, filtered by date, bounds and percentage of cloud cover
var dataset = ee.ImageCollection('COPERNICUS/S2_SR')
                  .filterDate('2019-01-01','2020-12-31')
                  .filterBounds(aoi)
                  .filter(ee.Filter.lt('CLOUDY_PIXEL_PERCENTAGE',10))
                  .map(maskS2clouds);
print("Sentinel 2 Image Collection",dataset);
var dem = ee.Image("NASA/NASADEM_HGT/001")
// Construct Classfication Dataset
// RS Index Cacluate(NDVI\NDWI\EVI\BSI)
var add_RS_index = function(img){
  var ndvi = img.normalizedDifference(['B8', 'B4']).rename('NDVI').copyProperties(img,['system:time_start']);
  var ndwi = img.normalizedDifference(['B3', 'B8']).rename('NDWI').copyProperties(img,['system:time_start']);
  var evi = img.expression('2.5 * ((NIR - RED) / (NIR + 6 * RED - 7.5 * BLUE + 1))',
  {
    'NIR': img.select('B8'),
    'RED': img.select('B4'),
    'BLUE': img.select('B2')
  }).rename('EVI').copyProperties(img,['system:time_start']);
  var bsi = img.expression('((RED + SWIR1) - (NIR + BLUE)) / ((RED + SWIR1) + (NIR + BLUE)) ',
  {
    'RED': img.select('B4'),
    'BLUE': img.select('B2'),
    'NIR': img.select('B8'),
    'SWIR1': img.select('B11'),

  }).rename('BSI').copyProperties(img,['system:time_start']);


  var ibi = img.expression('(2 * SWIR1 / (SWIR1 + NIR) - (NIR / (NIR + RED) + GREEN / (GREEN + SWIR1))) / (2 * SWIR1 / (SWIR1 + NIR) + (NIR / (NIR + RED) + GREEN / (GREEN + SWIR1)))', {
    'SWIR1': img.select('B11'),
    'NIR': img.select('B8'),
    'RED': img.select('B4'),
    'GREEN': img.select('B3')
  }).rename('IBI').copyProperties(img,['system:time_start']);
  return img.addBands([ndvi, ndwi, evi, bsi, ibi]);
};
var dataset = dataset.map(add_RS_index);
var bands = ['B2','B3','B4','B5','B6','B7','B8','B8A','B11','NDVI','NDWI','BSI'];
var imgcol_median = dataset.select(bands).median();
var aoi_dem = dem.select('elevation').clip(aoi).rename('DEM');
var construct_img = imgcol_median.addBands(aoi_dem).clip(aoi);
//分类样本
var train_points = cropland.merge(grassland).merge(city).merge(forest).merge(water);
var train_data= construct_img.sampleRegions({
  collection: train_points,
  properties: ['landcover'],
  scale: 10
});
//精度评价
var withRandom = train_data.randomColumn('random');//样本点随机的排列
var split = 0.7;
var trainingPartition = withRandom.filter(ee.Filter.lt('random', split));//筛选70%的样本作为训练样本
var testingPartition = withRandom.filter(ee.Filter.gte('random', split));//筛选30%的样本作为测试样本
//分类方法选择随机森林
var rf = ee.Classifier.smileRandomForest({
  numberOfTrees: 20,
  bagFraction: 0.8
}).train({
  features: train_data,
  classProperty: 'landcover',
  // inputProperties: inputbands
});
//对哨兵数据进行随机森林分类
var img_classfication = construct_img.classify(rf);
//运用测试样本分类,确定要进行函数运算的数据集以及函数
var test = testingPartition.classify(rf);
//计算混淆矩阵
var confusionMatrix = test.errorMatrix('landcover', 'classification');
print('confusionMatrix',confusionMatrix);//面板上显示混淆矩阵
print('overall accuracy', confusionMatrix.accuracy());//面板上显示总体精度
print('kappa accuracy', confusionMatrix.kappa());//面板上显示kappa值
Map.centerObject(aoi)
Map.addLayer(aoi);
Map.addLayer(img_classfication.clip(aoi), {min: 1, max: 4, palette: ['orange', 'blue', 'green','yellow']});
var class1=img_classfication.clip(aoi)
//导出分类图
Export.image.toDrive({
       image: class1,
       description: 'rfclass',
       fileNamePrefix: 'rf',  //文件命名
       folder: "class",  //保存的文件夹
       scale: 10,  //分辨率
       region: aoi,  //研究区
       maxPixels: 1e13,  //最大像元素,默认就好
       crs: "EPSG:4326"  //设置投影
   });

- 1
- 2
- 3
- 4
- 5
- 6
- 7
- 8
- 9
- 10
- 11
- 12
- 13
- 14
- 15
- 16
- 17
- 18
- 19
- 20
- 21
- 22
- 23
- 24
- 25
- 26
- 27
- 28
- 29
- 30
- 31
- 32
- 33
- 34
- 35
- 36
- 37
- 38
- 39
- 40
- 41
- 42
- 43
- 44
- 45
- 46
- 47
- 48
- 49
- 50
- 51
- 52
- 53
- 54
- 55
- 56
- 57
- 58
- 59
- 60
- 61
- 62
- 63
- 64
- 65
- 66
- 67
- 68
- 69
- 70
- 71
- 72
- 73
- 74
- 75
- 76
- 77
- 78
- 79
- 80
- 81
- 82
- 83
- 84
- 85
- 86
- 87
- 88
- 89
- 90
- 91
- 92
- 93
- 94
- 95
- 96
- 97
- 98
- 99
- 100
- 101
- 102
- 103
- 104
- 105
- 106
- 107
- 108
- 109
- 110
- 111
- 112
声明:本文内容由网友自发贡献,不代表【wpsshop博客】立场,版权归原作者所有,本站不承担相应法律责任。如您发现有侵权的内容,请联系我们。转载请注明出处:https://www.wpsshop.cn/w/笔触狂放9/article/detail/239194
推荐阅读
相关标签

