
热门标签
热门文章
- 1DEPTHAI 2.27.0 发布!
- 2设计模式——适配器模式_适配器设计模式
- 3Docker搭建Maven私有仓库Nexus--安装_docker nexus
- 4win10安装SQLserver2017/SQL Server Management Studio 17.9/SSDT for Visual Studio 2017 (15.8.2)详解_sqlserver2017 studio
- 5vue简单实现国际化来看看?_vue nacos使用_vue前端连nacos
- 6科技云报道:人工智能“顶流”齐聚WAIC 2024,他们都做了什么?_上海世界ai大会 隐私计算 助力大模型与数据可信融合
- 7如何修炼成优秀的程序员 《新程序员》全年4期纸质书+电子书 推广页面_《新程序员》杂志pdf下载
- 8基于单片机的智能空调设计_空调从硬件和软件的流程
- 9yolov5_obb~模型到部署_yolov5-0bb
- 10新版软考高项试题分析精选(三)_高项smart
当前位置: article > 正文
python多元线性回归--波士顿房价预测_python画出波士顿房价脊回归图
作者:码创造者 | 2024-07-17 21:23:47
赞
踩
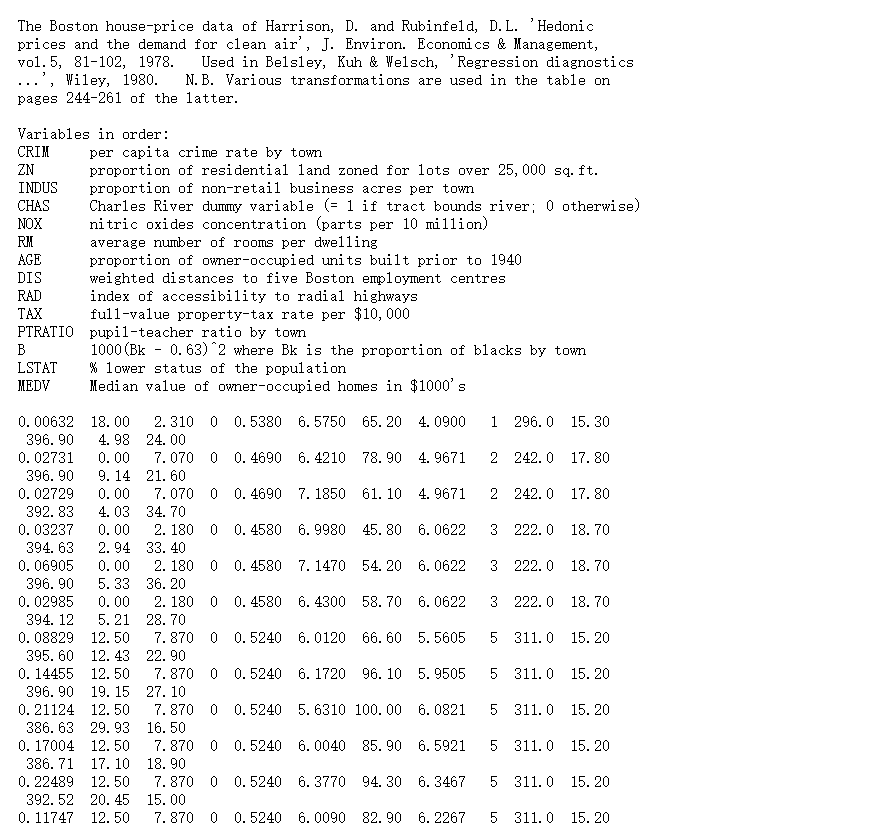
python画出波士顿房价脊回归图
数据集:http://lib.stat.cmu.edu/datasets/boston
访问这个网页可以看到里面有对每个数据集的介绍,特征(506行,13列),最后一列是房价
1:数据集导入,导包
- from sklearn.datasets import load_boston
- from sklearn.linear_model import LinearRegression # 导入线性回归类
- from sklearn.model_selection import train_test_split # 数据集的划分
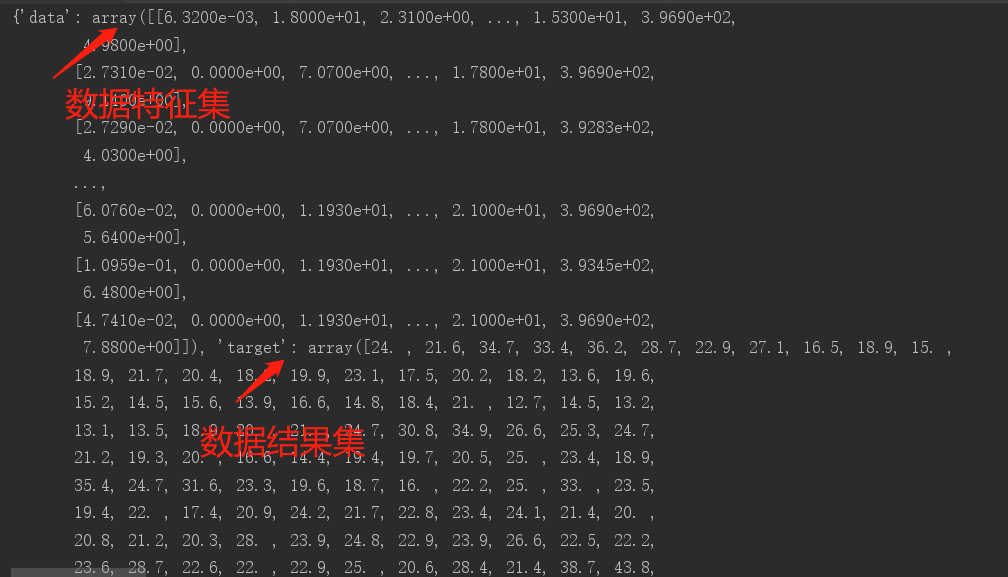
在python这边导的包数据是特征和结果分开的
2:获取数据
- #获取数据
- boston = load_boston()
- print(boston)
- # 目标值 特征值
- print(boston.data.shape) # 特征(506行,13列)
- x,y = boston.data,boston.target #分别获取特征值和目标值
3:对数据集进行划分
- # 3. 数据集划分 ( 训练集 + 测试集)
- x_train,x_test,y_train,y_test = train_test_split(x,y,test_size= 0.2,random_state=22) # random_state 随机种子
4:模型建立,评估
- # 4. 模型建立
- lr = LinearRegression()
- # 用回归对象训练模型 --- y = wx+b ---》 得到w和b的值
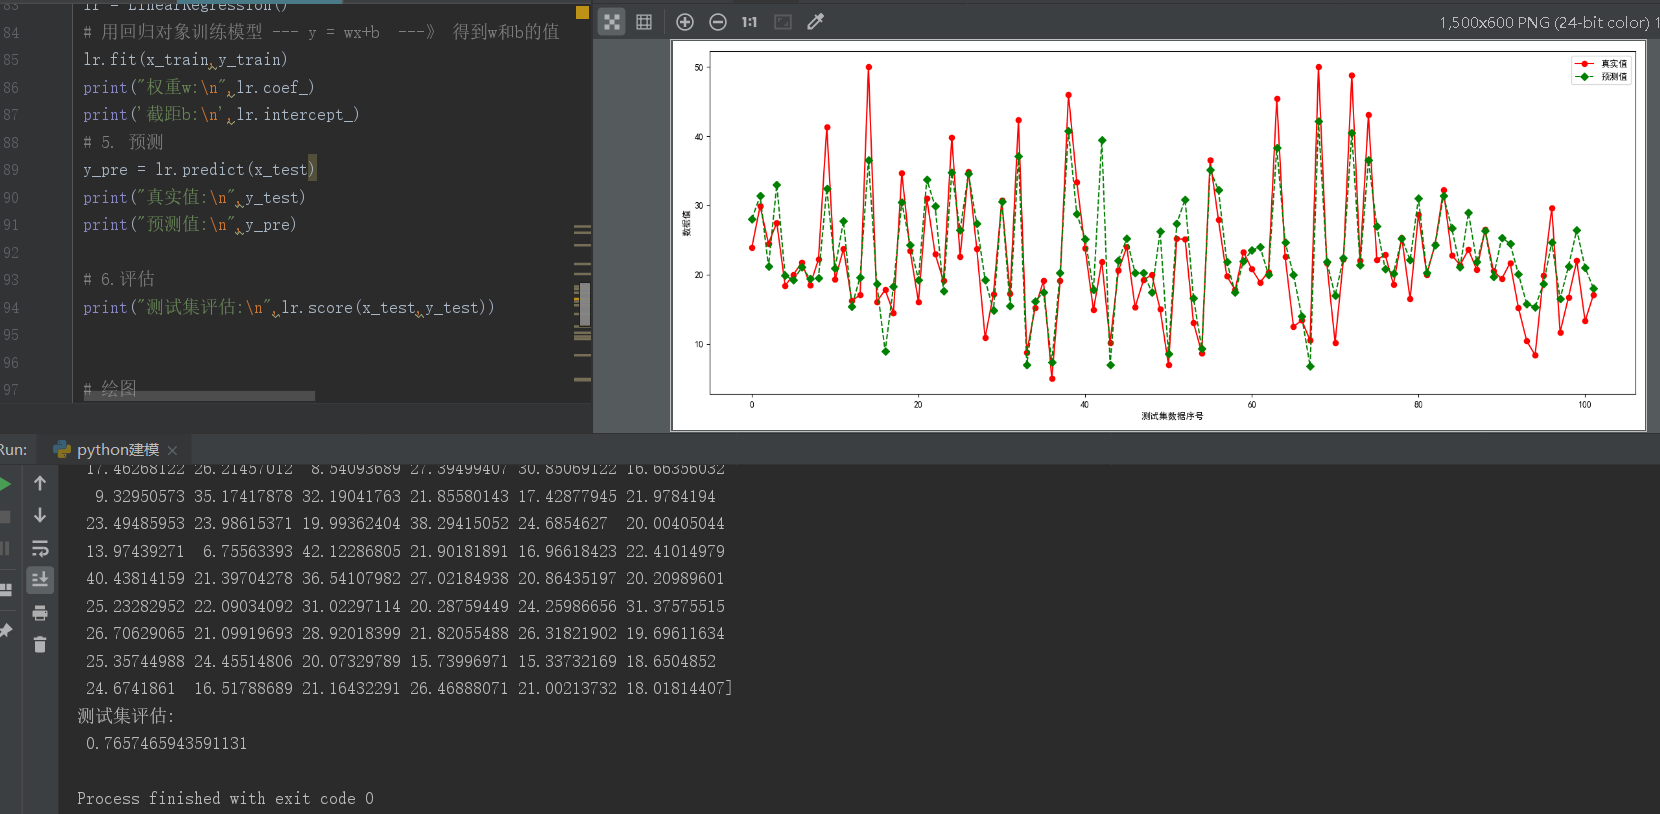
- lr.fit(x_train,y_train)
- print("权重w:\n",lr.coef_)
- print('截距b:\n',lr.intercept_)
- # 5. 预测
- y_pre = lr.predict(x_test)
- print("真实值:\n",y_test)
- print("预测值:\n",y_pre)
-
- # 6.评估(数据预测的相关性)
- print("测试集评估:\n",lr.score(x_test,y_test))
运行结果:
我们可以使用上一篇文章的绘图进行画图,评估出来的测试集结果为 0.7657465943591131
声明:本文内容由网友自发贡献,不代表【wpsshop博客】立场,版权归原作者所有,本站不承担相应法律责任。如您发现有侵权的内容,请联系我们。转载请注明出处:https://www.wpsshop.cn/w/码创造者/article/detail/842060
推荐阅读
- ...
赞
踩
相关标签

