
- 1LayoutLM——文本与布局的预训练用于文档图像理解
- 2拉扎维模拟CMOS集成电路设计西交张鸿老师课程P2~5视频学习记录_张鸿半导体模拟集成电路 ppt
- 3 B2B跨境电子商务平台综合服务解决方案
- 4NLP经典论文:FastText 笔记_fasttext论文
- 5每天读一篇文献8--Contextualized Medication Information Extraction Using Transformer-based Deep Learning Arc_gatortron
- 6SIM7600CE-CNSE 4G模块 树莓派/Windows连网指南_at+cnmp
- 7O2OA(翱途)移动端如何查看系统日志?_o2oa 日志
- 8【xinference】(4):在autodl上,使用xinference部署sd-turbo模型,可以根据文本生成图片,在RTX3080-20G上耗时1分钟,占用显存11G_3080ti跑sd
- 9【MMDetection3D】基于单目(Monocular)的3D目标检测入门实战_mmdetection 3d
- 10模型训练损失,正确率绘制曲线图_怎么画模型训练时的损失下降图
Python干货 | 制作遥感影像图_图像跟卫星地图的融合 python
赞
踩
0.前言
近50年来,Landsat系列卫星为我们提供了非常长时间序列的地球表面观测信息,现阶段Landsat卫星仍然在服役,为全球治理和科学研究提供了非常宝贵的数据。
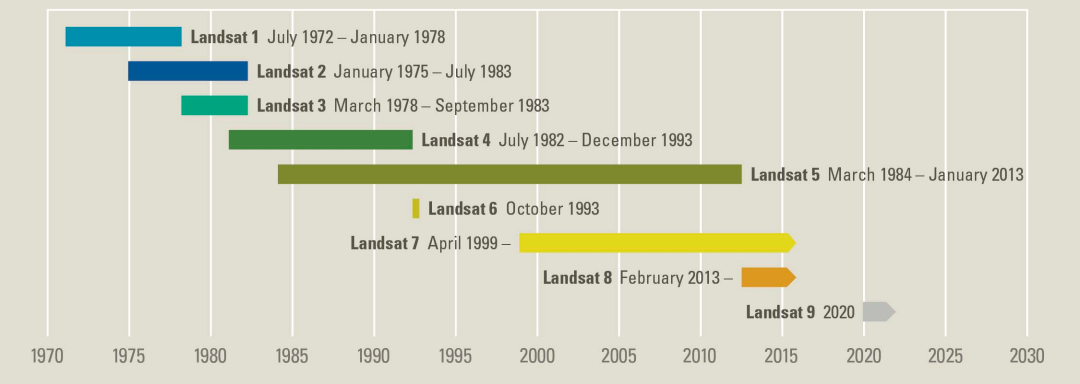
图源:USGS
现在是大数据时代,作为地球科学领域来说,遥感资料是不折不扣的宝贵的一手实测资料,且数据量非常的庞大。现阶段来说,可能大部分遥感资料生产的速度远远大于我们去利用它的速度,所以大部分遥感资料还是处于沉睡状态,在等待着技术的继续革新,唤醒这沉睡的数据,使其发光发热。
今天我们来探索一下使用Landsat数据来制作一张遥感影像图。先上图!图示为杭州湾
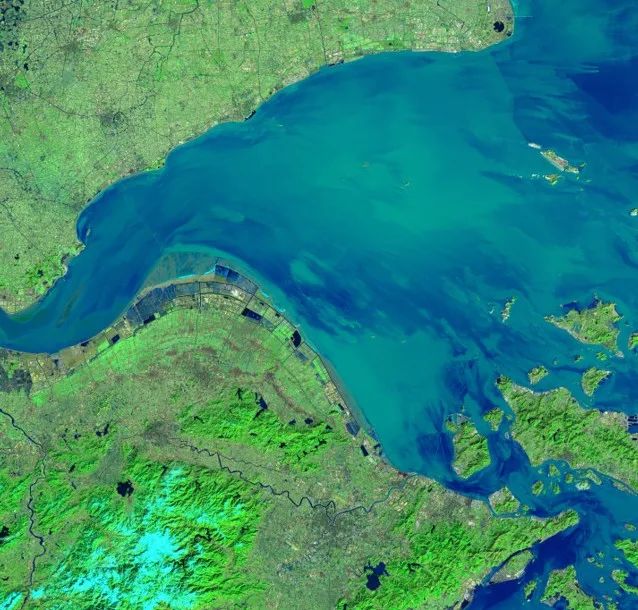
东南形胜,三吴都会,钱塘自古繁华。
1.准备工作
先准备下载好的Landsat8数据集,Landsat8中包括11个波段,在数据文件夹中,每个波段一个tif文件,这个tif文件中包括了坐标信息、波段值等信息,可以通过Python的rasterio模块来读取(如果有需要的话,可以详细写一下使用这个库来读取tif文件信息)。
导入接下来要用到的Python库。
- import numpy as np
- import os
- import matplotlib.pyplot as plt
- import tifffile as tiff
- from skimage import exposure
使用遥感影像制作底图时,通常是选取三个波段的数据分别作为图像RGB的三个通道,其中RGB表示红绿蓝三个通道,不同波段组合将得到不同的效果。
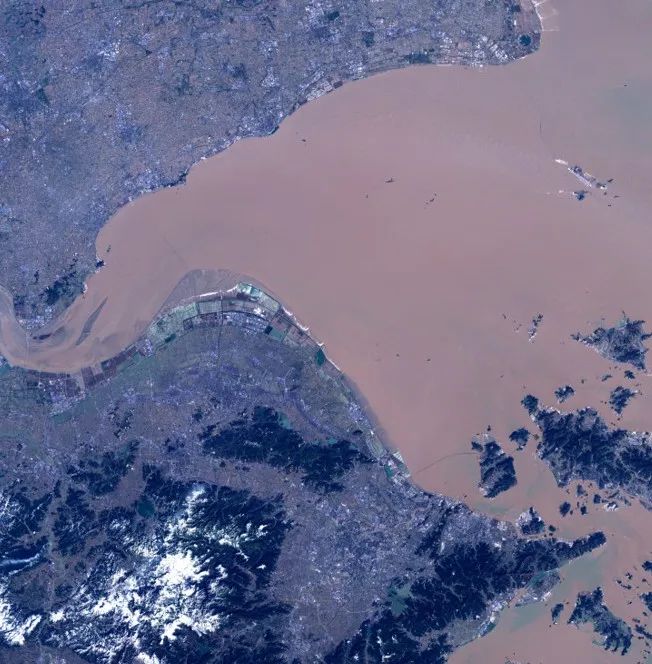
我们使用比较多的Google earth 中就用到了Landsat数据,他的波段组合是432。即使用Landsat的B4、B3和B2三个波段作为影像的三个通道。
上图的杭州湾图使用的是753。
如果波段组合是432情况下的效果如下图所示,432波段合成的真彩色图片,比较接近地物真实色彩,图像平淡,色调偏暗。
2.动起手来
首先把Landsat各个波段的数据读取出来。用到了一丢丢Python小技能,参见:
- l8path = r'pathOfLandsat8\LC08_L1TP_118039_20160126_20170330_01_T1'
- fileName = l8path.split("\")[-1]
- prefix = os.path.join(l8path,fileName)
- bands = ['B1', 'B2', 'B3', 'B4', 'B5', 'B6', 'B7', 'B10', 'B11']
- n_bands = len(bands)
- temp = tiff.imread(prefix + "_B1.TIF")
- arr = np.zeros((n_bands, np.shape(temp)[0], np.shape(temp)[1]), dtype=np.float)
- for i in range(n_bands):
- file2read = prefix + "_" + bands[i] + ".TIF"
- arr[i, :, :] = tiff.imread(file2read)
选取三个波段
rgb=(6, 4, 2) #Python下界为0,其实是753- rgb_bands = arr[rgb, :, :]
- rgb_bands = _stretch_im(rgb_bands, 2)
- rgb_bands = bytescale(rgb_bands).transpose([1, 2, 0])
- plt.close('all')
- fig, ax = plt.subplots(figsize=figSize)
- ax.imshow(rgb_bands, extent=extent)
- ax.set_title(title)
- ax.set(xticks=[], yticks=[])
其中用到了两个函数,其中一个是提高图像的对比度,另外一个将波段数据归一化到像素点常用的[0,255]区间内。
- def _stretch_im(arr, str_clip):
- s_min = str_clip
- s_max = 100 - str_clip
- arr_rescaled = np.zeros_like(arr)
- pLow, pHigh = np.percentile(arr[arr > 0], (s_min, s_max))
- arr_rescaled = exposure.rescale_intensity(arr, in_range=(pLow, pHigh))
- return arr_rescaled.copy()
- def bytescale(data, high=255, low=0, cmin=None, cmax=None):
- if data.dtype == "uint8":
- return data
- if high > 255:
- raise ValueError("high should be less than or equal to 255.")
- if low < 0:
- raise ValueError("low should be greater than or equal to 0.")
- if high < low:
- raise ValueError("high should be greater than or equal to low.")
- if cmin is None or (cmin < data.min()):
- cmin = float(data.min())
- if (cmax is None) or (cmax > data.max()):
- cmax = float(data.max())
- # Calculate range of values
- crange = cmax - cmin
- if crange < 0:
- raise ValueError("cmax should be larger than cmin.")
- elif crange == 0:
- raise ValueError(
- "cmax and cmin should not be the same value. Please specify "
- "cmax > cmin"
- )
- scale = float(high - low) / crange
- # If cmax is less than the data max, then this scale parameter will create
- # data > 1.0. clip the data to cmax first.
- data[data > cmax] = cmax
- bytedata = (data - cmin) * scale + low
- return (bytedata.clip(low, high) + 0.5).astype("uint8")

3.小结
大功告成!
这个遥感影像图,可以作为我们出图的底图,还可以实现两张遥感影像图的融合,在影像图上叠加自己想要叠加的数据,欲知详情,且听下回分解....
因遥感数据较大,关注公众号 海洋纪 ,后台回复 Landsat 获取数据及源码。
Tips:不同波段组合情况可以实现不同的效果,大家可以自己试试看。如543,652,765等。
最后,感谢阅读。

