
- 1文件服务器怎么设置文件夹大小,鸿蒙桌面图片怎么设置大小?鸿蒙桌面图标、小组件,文件夹变大变小设置教程...
- 2Kotlin Parcelable @Parcelize 知识总结_kotlin @parcelize
- 3uniapp APP 上传文件
- 4OpenAI视频大模型Sora底层剖析
- 5python函数的参数可以接收哪些类型的数据_可变数据类型不能作为python函数的参数...
- 6测试人员如何巧妙使用ChatGPT
- 7【Linux】-- 进程间通信_linux 进程间通信
- 8HarmonyOS 鸿蒙开发DevEco Studio OpenHarmony:使用真机进行调试_harmonyos真机调试
- 9微信小程序 java springboot 42.开放实验室预约管理系统(完整源码+数据库文件+万字文档+保姆级视频部署教程+配套环境)
- 10vue 打包发布项目404_vue3.0 打包index 404
c语言中填充不规则图形的颜色,如何用tikz填充不规则图形的颜色
赞
踩
我准备用tikz画这样的一个图
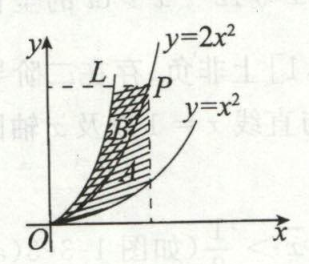
图中`A`和`B`区域打算用不同的... 显示全部
我准备用tikz画这样的一个图

图中`A`和`B`区域打算用不同的颜色区分,可是该如何用`\fill`(或其他命令)命令实现呢?
目前能做到的代码如下
```tex
\documentclass[UTF8]{standalone}
\usepackage{amsmath,fourier,ctex,tikz}
\begin{document}
\begin{tikzpicture}[domain=-0.3:3]
\draw[-latex] (-0.3,0) node[left=-3pt,below=-2pt] {$O$} -- (2,0) node[below] {$x$};
\draw[-latex] (0,-0.3) -- (0,2) node[left] {$y$};
\draw[domain=0:1.2] plot (\x,{0.5*\x^2}) node[right] {$y = x^{2}$};
\draw[domain=0:0.9] plot (\x,{2*\x^2}) node[right] {$y = 2x^{2}$};
\draw[domain=0:0.62] plot (\x,{3.5*\x^2}) node[above] {$L$};
\draw[dashed] (0.8,2*0.8^2) -- (0,2*0.8^2);
\draw[dashed] (0.8,2*0.8^2) -- (0.8,0);
\fill[domain=0:0.8,fill=gray] (0,0) plot (\x,{0.5*\x^2}) -- (0.8,2*0.8^2) plot (\x,{2*\x^2});
\end{tikzpicture}
\end{document}
```
不知道怎么才能将`y = 2x^{2}`设置为阴影的边界

