
热门标签
热门文章
- 1HTML+CSS期末大作业:在线音乐网站设计——简洁大气的KK音乐官网模板html源码(1页) HTML+CSS+JavaScript_音乐网站源码html
- 2基于crnn图像序列预测-pytorch代码实现——训练过程及常见错误_crnn 实现训练
- 3纳尼?github clone出现ssl错误?
- 4时间序列分类04:如何开发LSTMs模型实现人类活动识别(CNN-LSTM、ConvLSTM)_lstm分类模型
- 5《深入理解Java虚拟机》(第3版) 学习笔记,涵盖全书精髓_深入理解 java虚拟机第三版 mobi
- 6掘根宝典之C语言位字段
- 7麒麟LINUX(飞腾ARM)更新软件源_4.0.2sp2-server-ft2000
- 8Python实例:根据条件筛选列表、字典、集合中数据的方法_筛选出 list中满足条件的字典
- 9实现HttpServletRequest下多次获取流数据
- 10FE_VUE路由 细致解读router/index.js的配置_vue router index.js
当前位置: article > 正文
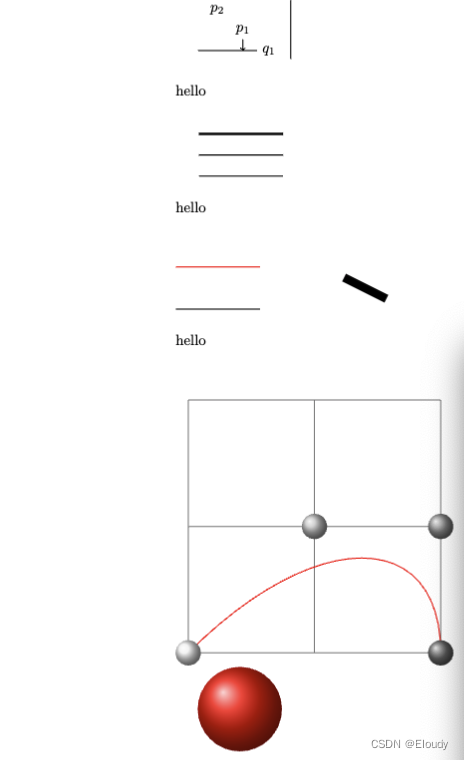
LaTex 矢量绘图之 Tikz 代码示例汇总_latex tikz 画二维图
作者:我家自动化 | 2024-03-15 00:39:51
赞
踩
latex tikz 画二维图
1,代码
- \documentclass[]{article}
- \usepackage{tikz}
- \usepackage{pgfplots}
- \begin{document}
-
-
- \begin{tikzpicture}
- \draw (0,0) -- (1,1);%hello
- \end{tikzpicture}
-
-
-
-
-
-
- \begin{tikzpicture}
- \draw[step=1,color=gray!40] (-2,-2) grid (2,2);
- \draw[->] (-3,0) -- (3,0);
- \draw[->] (0,-3) -- (0,3);
- \draw (0,0) circle (1);
- \end{tikzpicture}
-
-
- \begin{tikzpicture}
- \draw[help lines] ( -5,-5 ) grid ( 5, 5);
- \end{tikzpicture}
-
-
- \begin{tikzpicture}
- \draw[help lines] ( -5,-5 ) grid ( 5, 5);
- \draw[red] (-3,0) -- (3,0);
- \draw[red] (0,-3) -- (0,3);
- \end{tikzpicture}
-
-
- hello\\
-
- \begin{tikzpicture}
- \draw[->] (-3,3) -- (3,3);
- \draw[->>] (-3,2) -- (3,2);
- \draw[->|] (-3,1) -- (3,1);
- \draw[-to] (-3,0) -- (3,0);
- \draw[-latex] (-3,-1) -- (3,-1);
- \draw[-stealth] (-3,-2) -- (3,-2);
- \end{tikzpicture}
-
-
- \begin{tikzpicture}
- \draw[step=1,color=gray!40] (-2,-2) grid (2,2);
- \draw[->] (-3,0) -- (3,0);
- \draw[->] (0,-3) -- (0,3);
- \draw (0,0) circle (1);
- \end{tikzpicture}
-
-
- \begin{tikzpicture}
- \draw[step=1,color=gray!40] (-2,-2) grid (2,2);
- \draw[->] (-3,0) -- (3,0);
- \draw[->] (0,-3) -- (0,3);
- \draw (0,0) ellipse (1 and 0.5);
- \end{tikzpicture}
-
-
- \begin{tikzpicture}
- \draw[step=1,color=gray!40] (-2,-2) grid (2,2);
- \draw[->] (-3,0) -- (3,0);
- \draw[->] (0,-3) -- (0,3);
- \draw[color=gray!40] (0,0) circle (1); %
- \draw[color=red] (1,0) arc (0:45:1);
- \draw[color=gray!40] (0,0) ellipse (1 and 0.5);
- \draw[color=green] (1,0) arc (0:60:1 and 0.5);
- \end{tikzpicture}
-
- \begin{tikzpicture}[scale=2]
- \draw[step=1,color=gray!40] (-2,-2) grid (2,2);
- \draw[color=red] (-1,-1) rectangle (1,1);
- \end{tikzpicture}
-
-
- hello\\\\\\
-
- \begin{tikzpicture}
- \draw[step=1,color=gray!40] (-2,-2) grid (2,2);
- \path (1,1) coordinate (p1);
- \coordinate (p2) at ( 2, 0);
- \draw[dotted, red] (p1) -- (p2) ;
- \end{tikzpicture}
-
-
- \begin{tikzpicture}[scale=2]
- \draw[step=1,color=gray!40] (-2,-2) grid (2,2);
- \draw[latex-latex, red] (0,-2) -- ++(-1,1) -- ++(-1,-1);
- \draw[dashed, blue] (0,1) -- +(-1,1) -- +(-2,0);
- \end{tikzpicture}
- \\\\\\\\testtt\\\\\\\\
- \begin{tikzpicture}
- \node (node001) at (0,2) [draw] {test};
- \end{tikzpicture}
-
-
-
-
- \begin{tikzpicture}
- \node (node001) at (0,2) [draw] {node001};
- \node (node002) at (-2,0) [draw] {node002};
- \node (node003) at (2,0) [draw] {node003};
- \draw (node cs:name=node003,anchor=north) |- (0,1);
- \draw (node002.north) |- (0,1) -| (node cs:name=node001,anchor=south);
- \end{tikzpicture}
- \\\\good testtt\\\\\\\\
-
- \begin{tikzpicture}
- \node (p1) at (30:1) {$p_1$} ;
- \node (p2) at (75:1) {$p_2$} ;
- \draw (-0.2,0) -- (1.2,0) node[right] (xline) {$q_1$};
- \draw (2,-0.2) -- (2,1.2) node[above] (yline) {$q_2$};
- \draw[->] (p1) -- (p1 |- xline);
- \end{tikzpicture}
-
- \begin{tikzpicture}
- \node (p1) at (30:1) {$p_1$} ;
- \node (p2) at (75:1) {$p_2$} ;
- \draw (-0.2,0) -- (1.2,0) node[right] (xline) {$q_1$};
- \draw (2,-0.2) -- (2,1.2) node[above] (yline) {$q_2$};
- \draw[->] (p1) -- (p1 |- xline);
- \end{tikzpicture}
- \\\\hello\\\\
-
- \begin{tikzpicture}
- \draw [ultra thick] (0,1) -- (2,1);
- \draw [thick] (0,0.5) -- (2,0.5);
- \draw [thin] (0,0) -- (2,0);
- \end{tikzpicture}
- \\\\hello\\\\\\\\
- \begin{tikzpicture}
- \draw [line width=0.4pt] (0,0) -- (2,0);
- \draw[red] (0,1) -- (2,1);
- \draw [line width=0.2cm] (4,.75) -- (5,.25);
- \end{tikzpicture}
- \\\\hello\\\\\\\\
- \begin{tikzpicture}[scale=3]
- \draw[help lines] (0,0) grid (2,2);
- \draw[color=red] (0,0) .. controls (1,1) and (2,1) .. (2,0);
- \shade[ball color=gray!10] (0,0) circle (0.1);
- \shade[ball color=gray!40] (1,1) circle (0.1);
- \shade[ball color=gray!70] (2,1) circle (0.1);
- \shade[ball color=gray] (2,0) circle (0.1);
- \end{tikzpicture}
-
-
-
- \begin{tikzpicture}
- \shade[ball color=red] (1,2) circle (1);
- \end{tikzpicture}
- \\\\hello\\\\\\\\
- \begin{tikzpicture}[outline/.style={draw=#1,thick,fill=#1!50},
- outline/.default=black]
- \node [outline]
- at (0,1) {default};
- \node [outline=blue] at (0,0) {blue};
- \end{tikzpicture}
- \\\\hello\\\\\\\\
- \usetikzlibrary{positioning}
- \tikzset{place/.style={circle,draw=blue!50,fill=blue!20,
- thick,inner sep=0pt,minimum size=6mm}}
- \tikzset{transition/.style={rectangle,draw=black!50,
- fill=black!20,thick,inner sep=0pt,minimum size=4mm}}
- \tikzset{every label/.style=red}
- \begin{tikzpicture}[bend angle=45]
- \node[place] (waiting) {};
- \node[place] (critical) [below=of waiting] {};
- \node[place](semaphore) [below=of critical,label=above:$s\le3$] {};
- \node[transition](leave critical) [right=of critical]{};
- \node[transition] (enter critical)[left=of critical]{};
- \draw [->] (enter critical) to (critical);
- \draw [->] (waiting) to [bend right] (enter critical);
- \draw [->] (enter critical) to [bend right] (semaphore);
- \draw [->] (semaphore) to [bend right] (leave critical);
- \draw [->] (critical) to (leave critical);
- \draw [->] (leave critical) to [bend right] (waiting);
- \end{tikzpicture}
- \\\\hello\\\\\\\\
- \begin{tikzpicture}
- \draw[help lines] (0,0) grid (3,2);
- \foreach \x in {0,1,...,4}
- \draw[xshift=\x cm] (0,-1) -- (0,1);
- \end{tikzpicture}
- \\\\hello\\\\\\\\
- \begin{tikzpicture}
- \draw[help lines] (0,0) grid (3,2);
- \draw (0,0) -- (1,1);
- \draw[red] (0,0) -- ([xshift=1cm] 1,1);
- \end{tikzpicture}
- \\\\hello\\\\\\\\
- \begin{tikzpicture}
- \draw (0,0)[rotate=30] ellipse (2 and 1);
- \end{tikzpicture}
- \\\\hello\\\\\\\\
- \begin{tikzpicture}
- \begin{axis}
- \addplot{x*2};
- \end{axis}
- \end{tikzpicture}
- \\\\hello\\\\\\\\
- \begin{tikzpicture}
- \begin{axis}
- \addplot coordinates
- {(0,0)
- (1,1)
- (2,3)
- (3,9)};
- \end{axis}
- \end{tikzpicture}
- \\\\hello\\\\\\\\
- \\\\hello\\\\\\\\
- \\\\hello\\\\\\\\
- \\\\hello\\\\\\\\
- \\\\hello\\\\\\\\
- \\\\hello\\\\\\\\
- \\\\hello\\\\\\\\
- \\\\hello\\\\\\\\
- \\\\hello\\\\\\\\
- \end{document}

2,效果示例
声明:本文内容由网友自发贡献,不代表【wpsshop博客】立场,版权归原作者所有,本站不承担相应法律责任。如您发现有侵权的内容,请联系我们。转载请注明出处:https://www.wpsshop.cn/w/我家自动化/article/detail/238074
推荐阅读
相关标签

