- 1stm32单片机智能家居智能窗帘控制系统Proteus仿真全套资料_keil5arm、stm32cubemx、proteus 8 实现弄的智能家居主要技术
- 2Mac-iTerm2安装、配置和使用_mac安装iterm2
- 3io.net Windows保姆教程,手把手教你如何用Bitget部署撸空投_ionet教程
- 4【参数辨识】基于卡尔曼滤波EKF的多旋翼无人机模型参数辨识Matlab和simulink复现
- 5基于JAVA+SpringBoot+Vue+uniApp小程序的心理健康测试平台
- 6智慧矿山:EasyCVR助力矿井视频多业务融合及视频转发服务建设
- 7数据结构之“栈”(全方位认识)
- 860、基于浅层神经网络的数据拟合(matlab)
- 9在gitee上部署静态html表白烟花页面,Gitee Go (持续集成)服务(保姆级图文+实现代码)【杂记】_gitee 部署html
- 10图像算法八 —— 多种边缘检测算法(Sobel算子、Isotropic Sobel算子、Roberts算子、Prewitt算子、Laplacian算子、Canny算子)介绍及比较_边缘检测算子
Android Trace使用
赞
踩
目录
1. 使用命令比较准确方便,在android源码工程目录下,
external/chromium-trace# python systrace.py -help
Usage: systrace.py [options] [category1 [category2 ...]]
**Example: systrace.py -b 32768 -t 15 gfx input view sched freq**
Options:
-h, --help show this help message and exit
-o FILE write trace output to FILE
-j, --json write a JSON file
--link-assets (deprecated)
--asset-dir=ASSET_DIR
(deprecated)
-e DEVICE_SERIAL_NUMBER, --serial=DEVICE_SERIAL_NUMBER
adb device serial number
--target=TARGET choose tracing target (android or linux)
--timeout=TIMEOUT timeout for start and stop tracing (seconds)
--collection-timeout=COLLECTION_TIMEOUT
timeout for data collection (seconds)
-t N, --time=N trace for N seconds
-b N, --buf-size=N use a trace buffer size of N KB
-l, --list-categories
list the available categories and exit
Atrace options:
--atrace-categories=ATRACE_CATEGORIES
Select atrace categories with a comma-delimited list,
e.g. --atrace-categories=cat1,cat2,cat3
-k KFUNCS, --ktrace=KFUNCS
specify a comma-separated list of kernel functions to
trace
--no-compress Tell the device not to send the trace data in
compressed form.
-a APP_NAME, --app=APP_NAME
enable application-level tracing for comma-separated
list of app cmdlines
--from-file=FROM_FILE
read the trace from a file (compressed) rather than
running a live trace
Atrace process dump options:
--process-dump Capture periodic per-process memory dumps.
--process-dump-interval=PROCESS_DUMP_INTERVAL_MS
Interval between memory dumps in milliseconds.
--process-dump-full=PROCESS_DUMP_FULL_CONFIG
Capture full memory dumps for some processes. Value:
all, apps or comma-separated process names.
--process-dump-mmaps
Capture VM regions and memory-mapped files. It
increases dump size dramatically, hence only has
effect if --process-dump-full is a whitelist.
Ftrace options:
--ftrace-categories=FTRACE_CATEGORIES
Select ftrace categories with a comma-delimited list,
e.g. --ftrace-categories=cat1,cat2,cat3
WALT trace options:
--walt Use the WALT tracing agent. WALT is a device for
measuring latency of physical sensors on phones and
computers. See https://github.com/google/walt
external/chromium-trace# python systrace.py -l
gfx - Graphics
input - Input
view - View System
webview - WebView
wm - Window Manager
am - Activity Manager
sm - Sync Manager
audio - Audio
video - Video
camera - Camera
hal - Hardware Modules
res - Resource Loading
dalvik - Dalvik VM
rs - RenderScript
bionic - Bionic C Library
power - Power Management
pm - Package Manager
ss - System Server
database - Database
network - Network
adb - ADB
vibrator - Vibrator
aidl - AIDL calls
nnapi - NNAPI
rro - Runtime Resource Overlay
pdx - PDX services
sched - CPU Scheduling
irq - IRQ Events
irqoff - IRQ-disabled code section tracing
preemptoff - Preempt-disabled code section tracing
i2c - I2C Events
freq - CPU Frequency
idle - CPU Idle
disk - Disk I/O
mmc - eMMC commands
sync - Synchronization
workq - Kernel Workqueues
memreclaim - Kernel Memory Reclaim
regulators - Voltage and Current Regulators
binder_driver - Binder Kernel driver
binder_lock - Binder global lock trace
pagecache - Page cache
memory - Memory
gfx - Graphics (HAL)
ion - ION allocation (HAL)
external/chromium-trace# python systrace.py camera -t 5 -b 4096 -a com.xxx.xxx -o xxxtest_trace.html
Starting tracing (5 seconds)
Tracing completed. Collecting output...
Outputting Systrace results...
Tracing complete, writing results
Wrote trace HTML file: file:///home/xxx/external/chromium-trace/xxxtest_trace.html
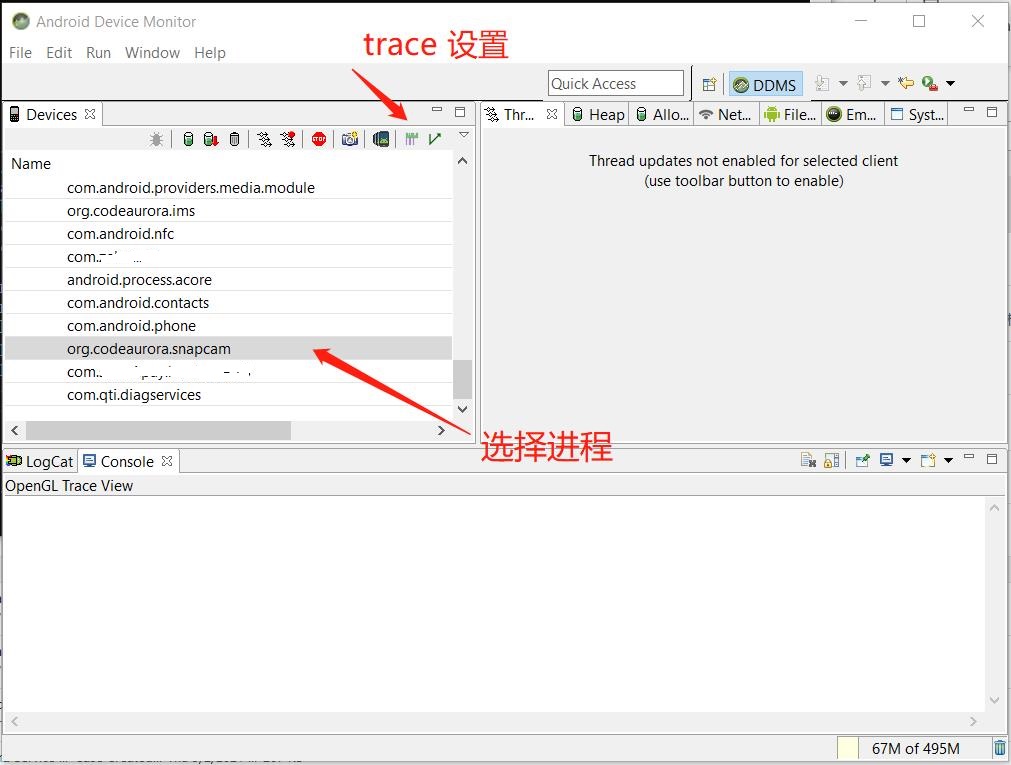
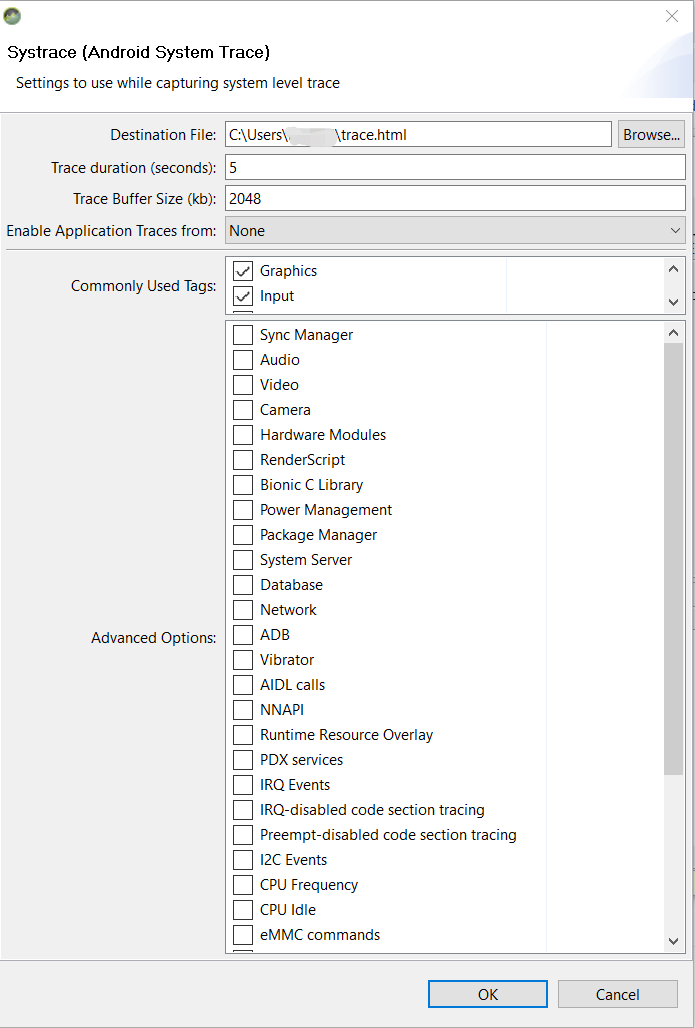
2.使用DDMS
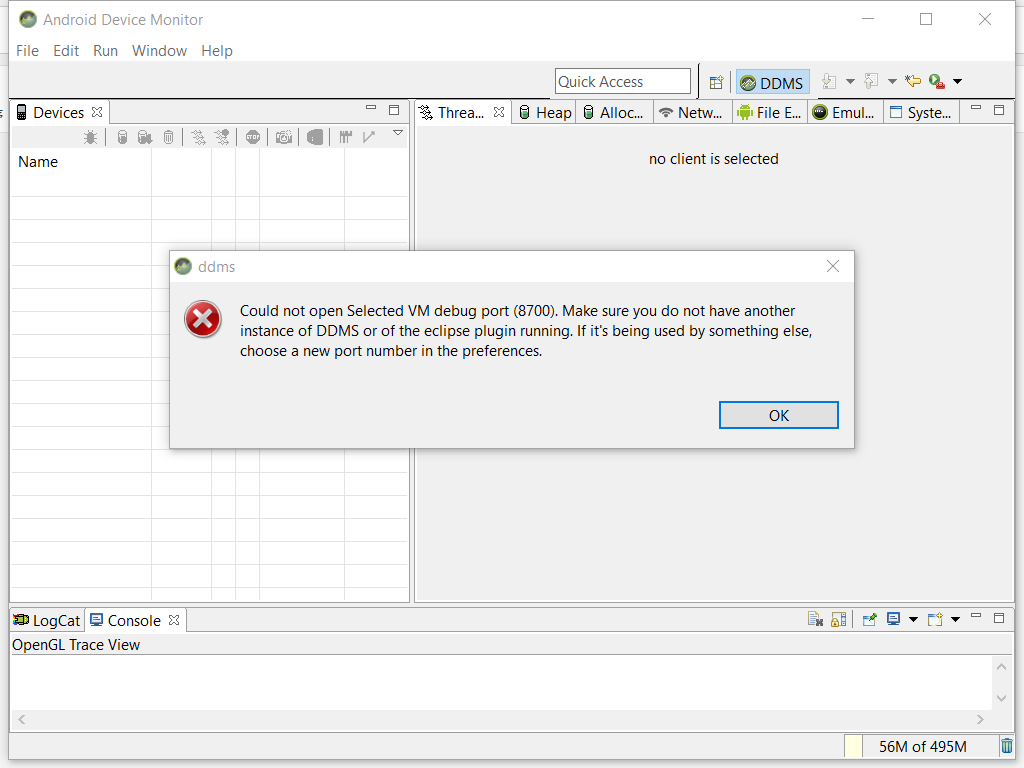
Android studio -> terminal 内执行 android sdk/tools/monitor.bat 调出DDMS(Dalvik Debug Monitor Server):
"could not open Selected VM debug port(8700) issue" ---- 关闭Android studio 即可解决。
3.添加Trace
In Android java,
- import android.os.Trace;
- Trace.beginSection("Trace section TAG");
- ... code ...
- Trace.endSection();
In C++,
- #include <Android/Trace.h>
- Atrace_beginSection("Trace section TAG");
- ... code ...
- Atrace_endSection();
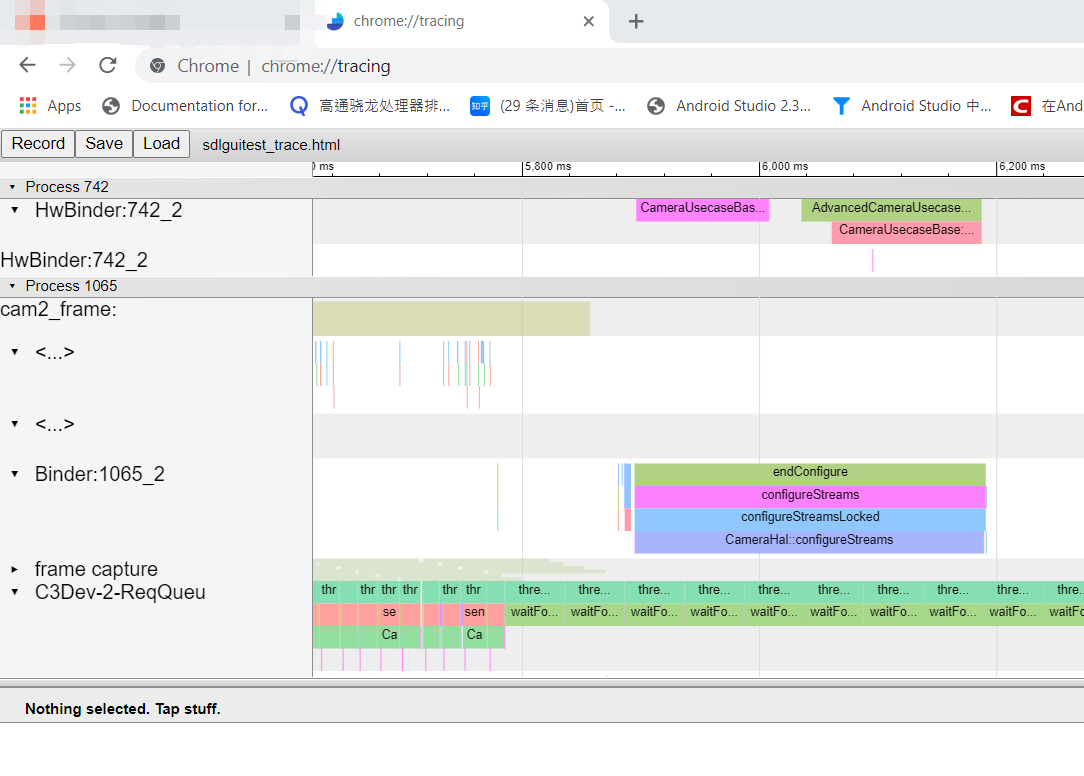
4.查看Trace 文件