
热门标签
热门文章
- 1stable diffusion本部部署教程(AI绘画)根据文字生成图片,根据图片生成类似的图片_tablediffusison生成背景图
- 2《 新手》web前端(axios)后端(java-springboot)对接简解_前端和后端怎么连接起来
- 3uniswapV2是如何调用合约中的transferFrom方法的_合约的transferfrom 函数 在后端还是前端执行
- 4MySQL高级-MVCC-原理分析(RC级别)
- 5自定义InputFormat、自定义OutputFormat_自定义inputformat实现
- 62d变换_2d 变换(15 分)。若采用齐次坐标表示 2d 图像上每个像素的坐标,对图像进行 2d
- 7Xilinx FPGA型号详解_xilinx fpga系列
- 8冒泡排序&快速排序(前后指针、挖坑、左右指针法)【Java实现】_冒泡排序法左指针和右指针和基准元素
- 9【2024华为OD机试C卷】 440、抢七游戏 | 机试真题+思路参考+代码解析(C语言、C++、Java、Py、JS)_华为od算法题:抢7游戏 知乎
- 10爬虫初学篇——看完这些还怕自己入门不了?_python 爬虫
当前位置: article > 正文
Python爬取全国大学排名 用pyecharts进行大屏可视化_爬取中国前100名的大学,并可视化
作者:运维做开发 | 2024-07-08 08:20:03
赞
踩
爬取中国前100名的大学,并可视化
爬取全国大学排名 用pyecharts进行可视化
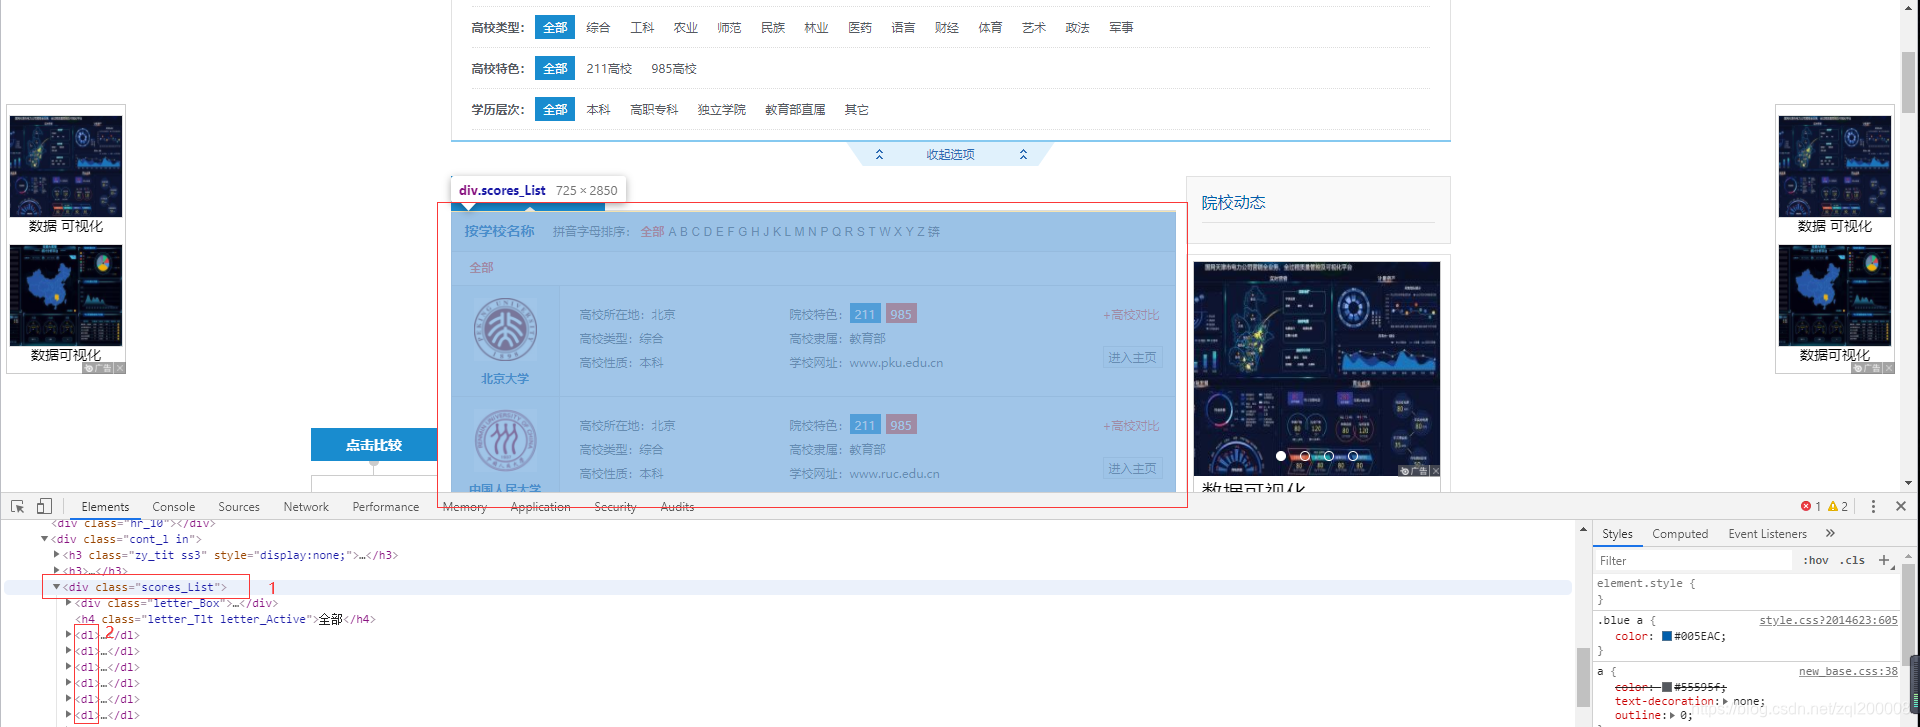
院校网址:http://college.gaokao.com/schlist/p
F12 先找到对应的全部list
需要先安装requests,lxml
可直接用 pip install requests pip install lxml 命令安装
导入需要的相关包
import requests
from lxml import etree
import time
import random
import csv

#避免网页反爬虫
headers = {
   'User-Agent': 'Mozilla/5.0 (Windows NT 10.0; WOW64) AppleWebKit/537.36 (KHTML, like Gecko) Chrome/75.0.3770.100 Safari/537.36'}
url = 'http://college.gaokao.com/schlist/p'
response = requests.get(url,headers=headers)
time.sleep(random.randint(0,2))	#同样用于反爬虫
- 1
- 2
- 3
- 4
- 5
- 6
- 7
- 8
- 9
- 10
- 11
- 12
再调用 lxml 获取到整页的学校名称
selector = etree.HTML(response.text)
all_list = selector.xpath('//*[starts-with(@class,"scores_List")]/dl')	#页面中全部学校  全部dl列
- 1
- 2
调用 for 循环获取dl中所有需要的数据
for sel in all_list:
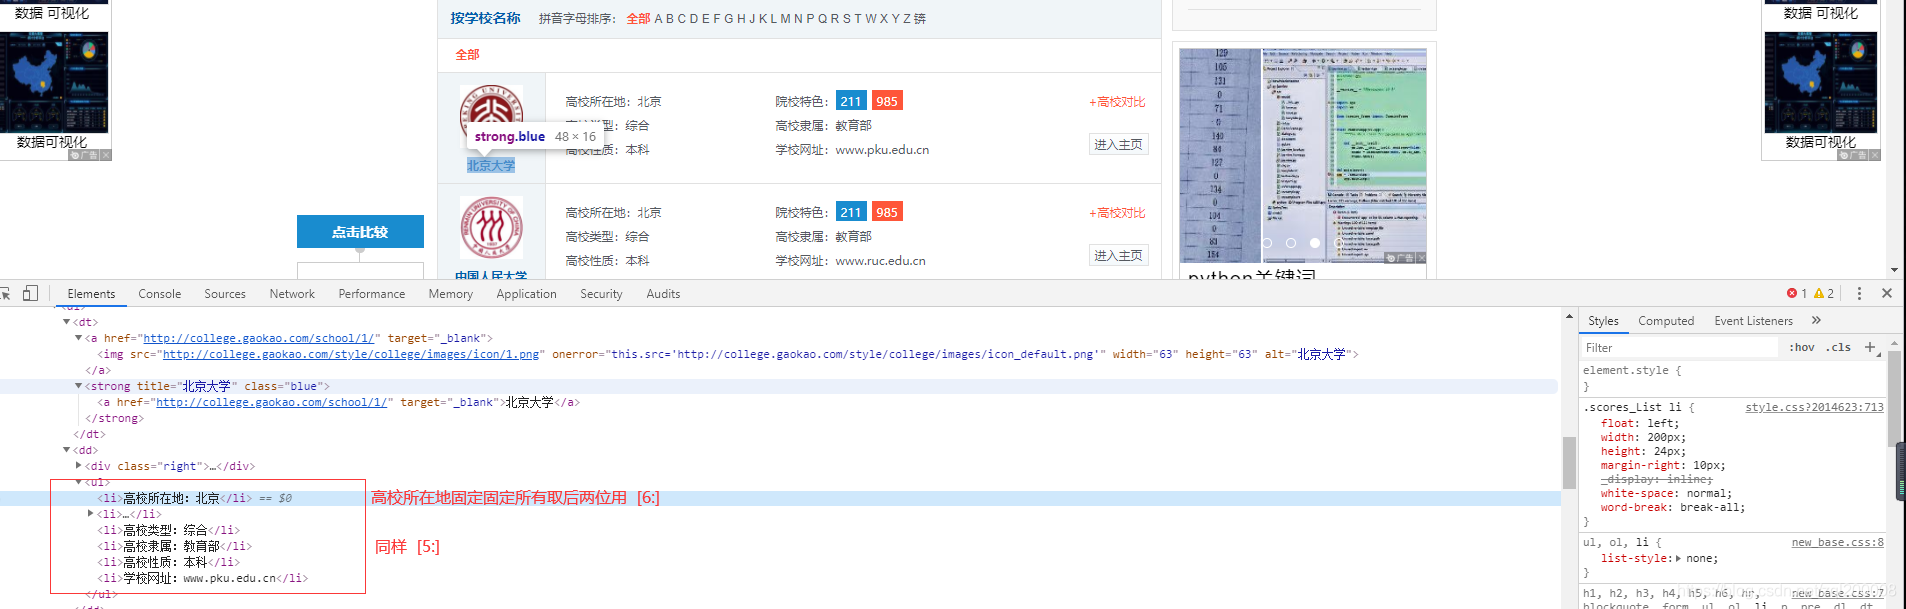
name = sel.xpath('dt/strong/a/text()')[0] #学校名称
place = sel.xpath('dd/ul/li[1]/text()')[0][6:] #高校所在地
type = sel.xpath('dd/ul/li[3]/text()')[0][5:] #高校类型
nature = sel.xpath('dd/ul/li[5]/text()')[0][5:] #高校性质
try: #获取的数据院校特色有地方空缺为避免出现空缺无法爬取数据
tese = sel.xpath('string(dd/ul/li[2])')[5:] #院校特色
except:
tese='' #遇到空缺值让院校特色等于null
lishu = sel.xpath('dd/ul/li[4]/text()')[0][5:] #高校隶属
- 1
- 2
- 3
- 4
- 5
- 6
- 7
- 8
- 9
- 10
- 11
- 12
最后将爬取的数据保存(保存成CSV文件格式)
    with open('school.csv','a',encoding='gbk',newline='')as file:
        writer = csv.writer(file)
        try:
            writer.writerow(item)
        except Exception as e:
            print(e)
- 1
- 2
- 3
- 4
- 5
- 6
- 7
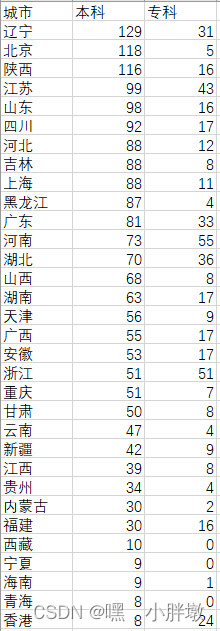
爬取的部分内容如下

最后用函数将全部代码串接
附上完整代码
import requests
from lxml import etree
import time
import random	#用于反爬 产生随机数
import csv

def csv_writer(item):
    with open('school.csv','a',encoding='gbk',newline='')as file:	#newline='' 保证写入到CSV中不空行
        writer = csv.writer(file)
        try:
            writer.writerow(item)
        except Exception as e:
            print(e)
def spider(url_):
    time.sleep(random.randint(0,2))		# 同样用于反爬虫
    res = requests.get(url_,headers=headers)
    return etree.HTML(res.text)
def parse(list_url):
    selector = spider(list_url)
    all_list = selector.xpath('//*[starts-with(@class,"scores_List")]/dl')	#页面中全部学校  全部dl列
    for sel in all_list:
    	try:
        	name = sel.xpath('dt/strong/a/text()')[0]	#学校名称
        except:
        	name = ''
        place = sel.xpath('dd/ul/li[1]/text()')[0][6:]	#高校所在地
        type = sel.xpath('dd/ul/li[3]/text()')[0][5:]	#高校类型
        nature = sel.xpath('dd/ul/li[5]/text()')[0][5:]	#高校性质
        try:	#获取的数据院校特色有地方空缺为避免出现空缺无法爬取数据
            tese = sel.xpath('string(dd/ul/li[2])')[5:]		#院校特色
        except:
            tese=''	#遇到空缺值让院校特色等于null
        lishu = sel.xpath('dd/ul/li[4]/text()')[0][5:]	#高校隶属
        # print(name,place,type,nature,tese,lishu)
        csv_writer([name,place,type,nature,tese,lishu])

#避免网页反爬虫
headers = {
   'User-Agent': 'Mozilla/5.0 (Windows NT 10.0; WOW64) AppleWebKit/537.36 (KHTML, like Gecko) Chrome/75.0.3770.100 Safari/537.36'}
url_ = 'http://college.gaokao.com/schlist/p'
all_url = [url_ + str(i) for i in range(1,107)]		#提取到所有学校的全部网址
for url in all_url:
    parse(url)

- 1
- 2
- 3
- 4
- 5
- 6
- 7
- 8
- 9
- 10
- 11
- 12
- 13
- 14
- 15
- 16
- 17
- 18
- 19
- 20
- 21
- 22
- 23
- 24
- 25
- 26
- 27
- 28
- 29
- 30
- 31
- 32
- 33
- 34
- 35
- 36
- 37
- 38
- 39
- 40
- 41
- 42
- 43
*为了方便观看爬取到情况将爬取的文件进行整合并进行可视化
**整合内容如下:
1、柱状图
from pyecharts.charts import Bar,Line
from pyecharts import options as opts
from pyecharts.globals import ThemeType #渲染主题
import pandas as pd
datafile = r'D:/Demo/school.xlsx'
data = pd.read_excel(datafile)

x1 = data['城市'].tolist()	#变成列表形式
y1 = data['本科'].tolist()
y2 = data['专科'].tolist()

#	更新后有两种调用方法	不习惯链式调用依旧可以单独调用方法
#	链式调用		V1版本要求>=1.0
bar = (
    Bar(init_opts=opts.InitOpts(theme=ThemeType.CHALK)) #主题
    .add_xaxis(x1)
    .add_yaxis("本科",y1,markpoint_opts=opts.MarkPointOpts(data=[opts.MarkPointItem(type_="max",name="最大值"),opts.MarkPointItem(type_="min",name="最小值")]),
               markline_opts=opts.MarkLineOpts(data=[opts.MarkLineItem(type_="max",name="最大值"),opts.MarkLineItem
- 1
- 2
- 3
- 4
- 5
- 6
- 7
- 8
- 9
- 10
- 11
- 12
- 13
- 14
- 15
- 16
- 17
声明:本文内容由网友自发贡献,不代表【wpsshop博客】立场,版权归原作者所有,本站不承担相应法律责任。如您发现有侵权的内容,请联系我们。转载请注明出处:https://www.wpsshop.cn/w/运维做开发/article/detail/798142
推荐阅读
相关标签

