
热门标签
热门文章
- 1python中英文文本情感分析_python英文情感分析
- 2Node.js简介_node.js是什么
- 32018年八月干货文章链接_基于stm32f373的手持光谱仪
- 4libpng warning iCCP 错误处理方法
- 5鸿蒙星河版笔记来袭!字符串、类型转换、运算符等_harmonyos 字符串转数字
- 6数据结构--链表题五--反转链表(leetcode-剑指 Offer II 024)_给定单链表头结点,反转链表,并返回反转后的头结点
- 7openssl3.2 - 官方demo学习 - mac - hmac-sha512.c_openssl 3.2 版本 hmac
- 8「网络安全大冒险:揭秘Django框架的五大安全秘籍」_django安全性
- 9Verilog设计实现俄罗斯方块游戏_基于verilog实现迷宫游戏
- 10大模型并行训练指南:Megatron-DeepSpeed的模型并行与数据并行_megatron deepspeed
当前位置: article > 正文
OpenLayers 3地图添加图标_openlayers添加图标
作者:花生_TL007 | 2024-06-16 20:48:40
赞
踩
openlayers添加图标
OpenLayers 3地图添加图标
一、overlay方式在地图添加图标
1、项目结构
2、map.html
<!Doctype html>
<html xmlns='http://www.w3.org/1999/xhtml'>
<head>
    <meta http-equiv='Content-Type' content='text/html;charset=utf-8'>
    <meta http-equiv='X-UA-Compatible' content='IE=edge,chrome=1'>
    <meta content='always' name='referrer'>
    <title>OpenLayers 3 :overlay方式在地图添加图标</title>
    <link href='ol.css ' rel='stylesheet' type='text/css'/>
    <script type='text/javascript' src='ol.js' charset='utf-8'></script>
</head>

<body>

<div id='map' style='width: 800px;height: 500px;margin: auto'></div>
<div id="anchor"><img src="images/user.png" alt="图标"/></div>

<script>

    /**
     *  创建地图
     */
    var map = new ol.Map({

        // 设置地图图层
        layers: [
            //创建一个使用Open Street Map地图源的图层
            new ol.layer.Tile({
                source: new ol.source.OSM()
            })
        ],

        // 设置显示地图的视图
        view: new ol.View({
            center: [0, 0],       // 设置地图显示中心于经度0度,纬度0度处
            zoom: 5           // 设置地图显示层级为5
        }),

        // 让id为map的div作为地图的容器
        target: 'map'

    });

    /**
     * 创建覆盖对象,覆盖对象引用的是地图上的图片
     */
    var anchor = new ol.Overlay({
        element: document.getElementById('anchor')
    });

    /**
     * 设置覆盖对象位置
     */
    anchor.setPosition([0, 0])

    /**
     * 将覆盖对象添加到地图上
     */
    map.addOverlay(anchor)


</script>
</body>
</html>

- 1
- 2
- 3
- 4
- 5
- 6
- 7
- 8
- 9
- 10
- 11
- 12
- 13
- 14
- 15
- 16
- 17
- 18
- 19
- 20
- 21
- 22
- 23
- 24
- 25
- 26
- 27
- 28
- 29
- 30
- 31
- 32
- 33
- 34
- 35
- 36
- 37
- 38
- 39
- 40
- 41
- 42
- 43
- 44
- 45
- 46
- 47
- 48
- 49
- 50
- 51
- 52
- 53
- 54
- 55
- 56
- 57
- 58
- 59
- 60
- 61
- 62
- 63
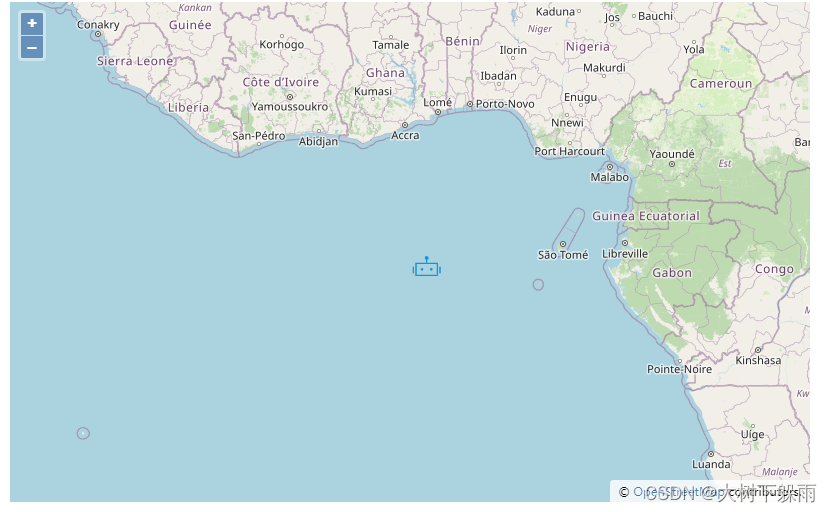
3、运行结果
二、Feature + Style方式在地图添加图标
1、map2.html
<!Doctype html>
<html xmlns='http://www.w3.org/1999/xhtml'>
<head>
    <meta http-equiv='Content-Type' content='text/html;charset=utf-8'>
    <meta http-equiv='X-UA-Compatible' content='IE=edge,chrome=1'>
    <meta content='always' name='referrer'>
    <title>OpenLayers 3 :Feature + Style方式在地图添加图标</title>
    <link href='ol.css ' rel='stylesheet' type='text/css'/>
    <script type='text/javascript' src='ol.js' charset='utf-8'></script>
</head>

<body>

<div id='map' style='width: 800px;height: 500px;margin: auto'></div>

<script>


    /**
     * 创建一个Vector的layer来放置图标
     */
    var layer = new ol.layer.Vector({
        source: new ol.source.Vector()
    })

    /**
     *  创建地图
     */
    var map = new ol.Map({

        // 设置地图图层
        layers: [
            //创建一个使用Open Street Map地图源的图层
            new ol.layer.Tile({
                source: new ol.source.OSM()
            }),
            layer
        ],

        // 设置显示地图的视图
        view: new ol.View({
            center: [0, 0],       // 设置地图显示中心于经度0度,纬度0度处
            zoom: 10           // 设置地图显示层级为5
        }),

        // 让id为map的div作为地图的容器
        target: 'map'

    });

    //创建一个Feature,并设置好在地图的位置
    var anchor = new ol.Feature({
        geometry: new ol.geom.Point([0, 0])
    });

    // 设置Feature样式,在样式中就可以设置图标
    anchor.setStyle(new ol.style.Style({
        image: new ol.style.Icon({
            src: 'images/user.png'
        })
    }));

    // 将Feature添加到之前的创建的layer中去
    layer.getSource().addFeature(anchor);


    // 监听地图层级变化
    map.getView().on('change:resolution', function(){
        //获取图标的样式对象
        var style = anchor.getStyle();

        // 重新设置图标的缩放率,基于层级10来做缩放
        style.getImage().setScale(this.getZoom() / 10);

        anchor.setStyle(style);

    })


</script>
</body>
</html>
- 1
- 2
- 3
- 4
- 5
- 6
- 7
- 8
- 9
- 10
- 11
- 12
- 13
- 14
- 15
- 16
- 17
- 18
- 19
- 20
- 21
- 22
- 23
- 24
- 25
- 26
- 27
- 28
- 29
- 30
- 31
- 32
- 33
- 34
- 35
- 36
- 37
- 38
- 39
- 40
- 41
- 42
- 43
- 44
- 45
- 46
- 47
- 48
- 49
- 50
- 51
- 52
- 53
- 54
- 55
- 56
- 57
- 58
- 59
- 60
- 61
- 62
- 63
- 64
- 65
- 66
- 67
- 68
- 69
- 70
- 71
- 72
- 73
- 74
- 75
- 76
- 77
- 78
- 79
- 80
- 81
- 82
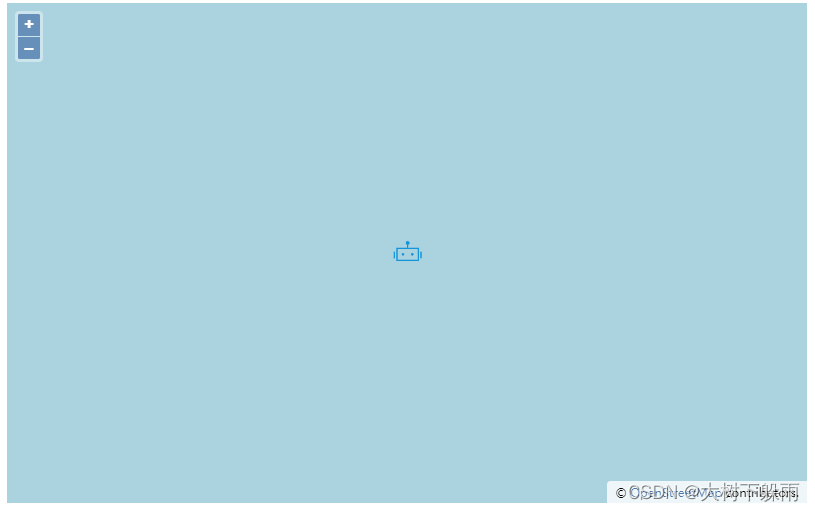
2、运行结果
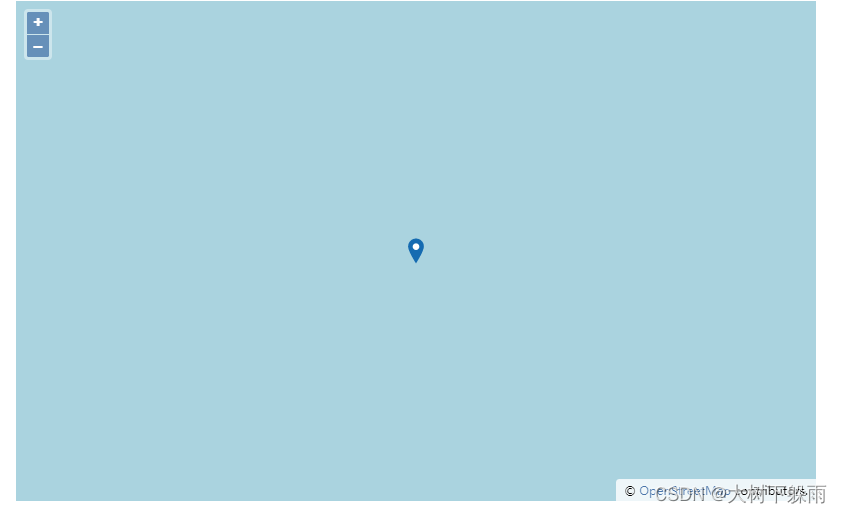
三、地图添加svg图标
1、map3.html
<!Doctype html>
<html xmlns='http://www.w3.org/1999/xhtml'>
<head>
    <meta http-equiv='Content-Type' content='text/html;charset=utf-8'>
    <meta http-equiv='X-UA-Compatible' content='IE=edge,chrome=1'>
    <meta content='always' name='referrer'>
    <title>OpenLayers 3 :地图添加svg图标</title>
    <link href='ol.css ' rel='stylesheet' type='text/css'/>
    <script type='text/javascript' src='ol.js' charset='utf-8'></script>
</head>

<body>

<div id='map' style='width: 800px;height: 500px;margin: auto'></div>

<script>


    /**
     * 创建一个Vector的layer来放置图标
     */
    var layer = new ol.layer.Vector({
        source: new ol.source.Vector()
    })

    /**
     *  创建地图
     */
    var map = new ol.Map({

        // 设置地图图层
        layers: [
            //创建一个使用Open Street Map地图源的图层
            new ol.layer.Tile({
                source: new ol.source.OSM()
            }),
            layer
        ],

        // 设置显示地图的视图
        view: new ol.View({
            center: [0, 0],       // 设置地图显示中心于经度0度,纬度0度处
            zoom: 10           // 设置地图显示层级为5
        }),

        // 让id为map的div作为地图的容器
        target: 'map'
    });


    //创建一个Feature,并设置好在地图的位置
    var anchor = new ol.Feature({
        geometry: new ol.geom.Point([0,0])
    });

    //构建svg的Image对象
    // svg图标代码
    var svg = '<svg version="1.1" id="Layer_1" xmlns="http://www.w3.org/2000/svg" xmlns:xlink="http://www.w3.org/1999/xlink" x="0px" y="0px" width="30px" height="30px" viewBox="0 0 30 30" enable-background="new 0 0 30 30" xml:space="preserve">'+
        '<path fill="#156BB1" d="M22.906,10.438c0,4.367-6.281,14.312-7.906,17.031c-1.719-2.75-7.906-12.665-7.906-17.031S10.634,2.531,15,2.531S22.906,6.071,22.906,10.438z"/>'+
        '<circle fill="#FFFFFF" cx="15" cy="10.677" r="3.291"/></svg>';
    //创建图片对象
    var mysvg = new Image();
    mysvg.src = 'data:image/svg+xml,' + escape(svg);


    //图标设置样式
    anchor.setStyle(new ol.style.Style({
        image: new ol.style.Icon({
            img: mysvg,    // 设置Image对象
            imgSize: [30, 30]    // 及图标大小
        })
    }));

    // 将Feature添加到之前的创建的layer中去
    layer.getSource().addFeature(anchor);


</script>
</body>
</html>
- 1
- 2
- 3
- 4
- 5
- 6
- 7
- 8
- 9
- 10
- 11
- 12
- 13
- 14
- 15
- 16
- 17
- 18
- 19
- 20
- 21
- 22
- 23
- 24
- 25
- 26
- 27
- 28
- 29
- 30
- 31
- 32
- 33
- 34
- 35
- 36
- 37
- 38
- 39
- 40
- 41
- 42
- 43
- 44
- 45
- 46
- 47
- 48
- 49
- 50
- 51
- 52
- 53
- 54
- 55
- 56
- 57
- 58
- 59
- 60
- 61
- 62
- 63
- 64
- 65
- 66
- 67
- 68
- 69
- 70
- 71
- 72
- 73
- 74
- 75
- 76
- 77
- 78
- 79
- 80
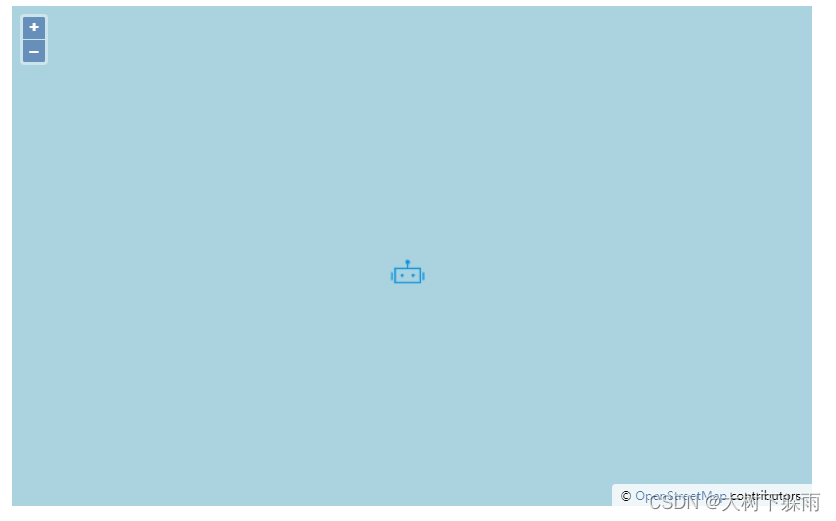
2、运行结果
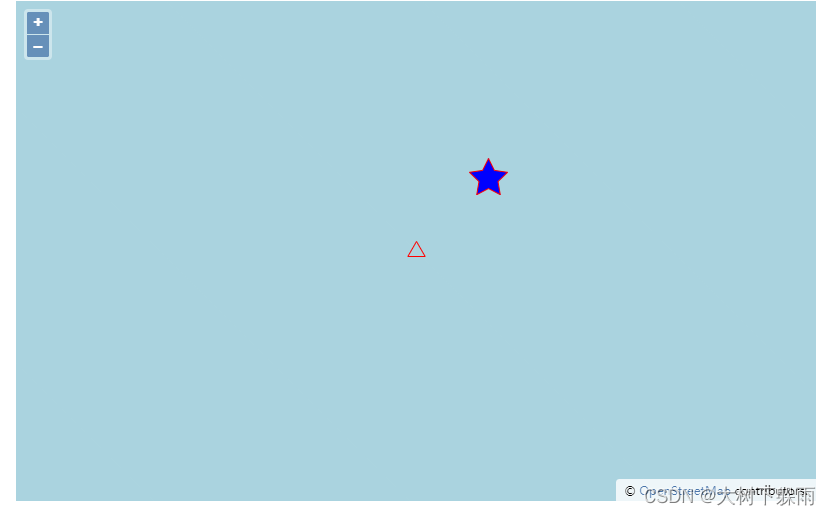
四、规则几何体图标
1、map4.html
<!Doctype html>
<html xmlns='http://www.w3.org/1999/xhtml'>
<head>
    <meta http-equiv='Content-Type' content='text/html;charset=utf-8'>
    <meta http-equiv='X-UA-Compatible' content='IE=edge,chrome=1'>
    <meta content='always' name='referrer'>
    <title>OpenLayers 3 :规则几何体图标</title>
    <link href='ol.css ' rel='stylesheet' type='text/css'/>
    <script type='text/javascript' src='ol.js' charset='utf-8'></script>
</head>

<body>

<div id='map' style='width: 800px;height: 500px;margin: auto'></div>

<script>

    /**
     * 创建一个Vector的layer来放置图标
     */
    var layer = new ol.layer.Vector({
        source: new ol.source.Vector()
    })


    /**
     *  创建地图
     */
    var map = new ol.Map({

        // 设置地图图层
        layers: [
            //创建一个使用Open Street Map地图源的图层
            new ol.layer.Tile({
                source: new ol.source.OSM()
            }),
            layer
        ],

        // 设置显示地图的视图
        view: new ol.View({
            center: [0, 0],       // 设置地图显示中心于经度0度,纬度0度处
            zoom: 10,           // 设置地图显示层级为10
            projection: 'EPSG:4326' //设置投影
        }),

        // 让id为map的div作为地图的容器
        target: 'map'
    });

    // 添加一个三角形
    var shape = new ol.Feature({
        geometry: new ol.geom.Point([0, 0])
    });
    shape.setStyle(new ol.style.Style({
        image: new ol.style.RegularShape({
            points: 3,    // 顶点数
            radius: 10,    // 图形大小,单位为像素
            stroke: new ol.style.Stroke({ // 设置边的样式
                color: 'red',
                size: 2
            })
        })
    }));

    // 将Feature添加到之前的创建的layer中去
    layer.getSource().addFeature(shape);

    // 添加一个五星
    var star = new ol.Feature({
        geometry: new ol.geom.Point([0.1, 0.1])
    });
    star.setStyle(new ol.style.Style({
        image: new ol.style.RegularShape({
            points: 5,    // 顶点个数
            radius1: 20, // 外圈大小
            radius2: 10, // 内圈大小
            stroke: new ol.style.Stroke({ // 设置边的样式
                color: 'red',
                size: 2
            }),
            fill: new ol.style.Fill({ // 设置五星填充样式
                color: 'blue'
            })
        })
    }));

    // 将Feature添加到之前的创建的layer中去
    layer.getSource().addFeature(star);


</script>
</body>
</html>
- 1
- 2
- 3
- 4
- 5
- 6
- 7
- 8
- 9
- 10
- 11
- 12
- 13
- 14
- 15
- 16
- 17
- 18
- 19
- 20
- 21
- 22
- 23
- 24
- 25
- 26
- 27
- 28
- 29
- 30
- 31
- 32
- 33
- 34
- 35
- 36
- 37
- 38
- 39
- 40
- 41
- 42
- 43
- 44
- 45
- 46
- 47
- 48
- 49
- 50
- 51
- 52
- 53
- 54
- 55
- 56
- 57
- 58
- 59
- 60
- 61
- 62
- 63
- 64
- 65
- 66
- 67
- 68
- 69
- 70
- 71
- 72
- 73
- 74
- 75
- 76
- 77
- 78
- 79
- 80
- 81
- 82
- 83
- 84
- 85
- 86
- 87
- 88
- 89
- 90
- 91
- 92
- 93
- 94
2、运行结果
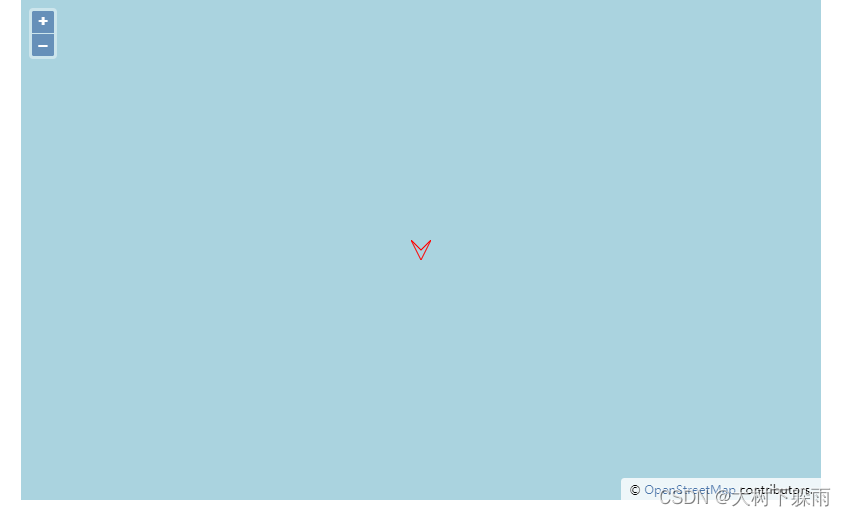
五、canvas自绘图标
1、map5.html
<!Doctype html>
<html xmlns='http://www.w3.org/1999/xhtml'>
<head>
    <meta http-equiv='Content-Type' content='text/html;charset=utf-8'>
    <meta http-equiv='X-UA-Compatible' content='IE=edge,chrome=1'>
    <meta content='always' name='referrer'>
    <title>OpenLayers 3 :canvas自绘图标</title>
    <link href='ol.css ' rel='stylesheet' type='text/css'/>
    <script type='text/javascript' src='ol.js' charset='utf-8'></script>
</head>

<body>

<div id='map' style='width: 800px;height: 500px;margin: auto'></div>

<script>

    /**
     * 创建一个Vector的layer来放置图标
     */
    var layer = new ol.layer.Vector({
        source: new ol.source.Vector()
    })

    /**
     *  创建地图
     */
    var map = new ol.Map({

        // 设置地图图层
        layers: [
            //创建一个使用Open Street Map地图源的图层
            new ol.layer.Tile({
                source: new ol.source.OSM()
            }),
            layer
        ],

        // 设置显示地图的视图
        view: new ol.View({
            center: [0, 0],       // 设置地图显示中心于经度0度,纬度0度处
            zoom: 10           // 设置地图显示层级为5
        }),

        // 让id为map的div作为地图的容器
        target: 'map'

    });

    // 使用canvas绘制一个不规则几何图形
    var canvas =document.createElement('canvas');
    canvas.width = 20;
    canvas.height = 20;
    var context = canvas.getContext("2d");
    context.strokeStyle = "red";
    context.lineWidth = 1;
    context.beginPath();
    context.moveTo(0, 0);
    context.lineTo(20, 10);
    context.lineTo(0, 20);
    context.lineTo(10, 10);
    context.lineTo(0, 0);
    context.stroke();

    // 把绘制了的canvas设置到style里面
    var style = new ol.style.Style({
        image: new ol.style.Icon({
            img: canvas,
            imgSize: [canvas.width, canvas.height],
            rotation: 90 * Math.PI / 180
        })
    });

    //创建一个Feature,并设置好在地图的位置
    var shape = new ol.Feature({
        geometry: new ol.geom.Point([0, 0])
    });

    // 应用具有不规则几何图形的样式到Feature
    shape.setStyle(style);

    // 将Feature添加到之前的创建的layer中去
    layer.getSource().addFeature(shape);


</script>
</body>
</html>
- 1
- 2
- 3
- 4
- 5
- 6
- 7
- 8
- 9
- 10
- 11
- 12
- 13
- 14
- 15
- 16
- 17
- 18
- 19
- 20
- 21
- 22
- 23
- 24
- 25
- 26
- 27
- 28
- 29
- 30
- 31
- 32
- 33
- 34
- 35
- 36
- 37
- 38
- 39
- 40
- 41
- 42
- 43
- 44
- 45
- 46
- 47
- 48
- 49
- 50
- 51
- 52
- 53
- 54
- 55
- 56
- 57
- 58
- 59
- 60
- 61
- 62
- 63
- 64
- 65
- 66
- 67
- 68
- 69
- 70
- 71
- 72
- 73
- 74
- 75
- 76
- 77
- 78
- 79
- 80
- 81
- 82
- 83
- 84
- 85
- 86
- 87
- 88
2、运行结果
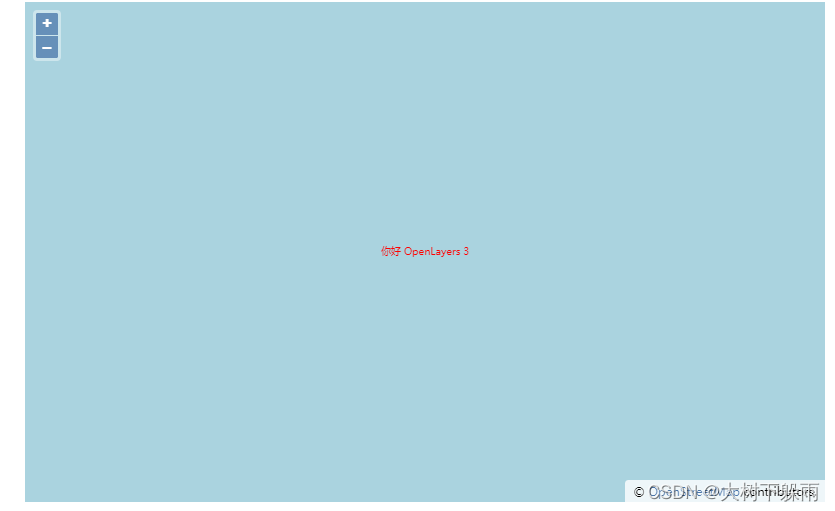
六、文字标注
1、map6.html
<!Doctype html>
<html xmlns='http://www.w3.org/1999/xhtml'>
<head>
    <meta http-equiv='Content-Type' content='text/html;charset=utf-8'>
    <meta http-equiv='X-UA-Compatible' content='IE=edge,chrome=1'>
    <meta content='always' name='referrer'>
    <title>OpenLayers 3 :文字标注</title>
    <link href='ol.css ' rel='stylesheet' type='text/css'/>
    <script type='text/javascript' src='ol.js' charset='utf-8'></script>
</head>

<body>

<div id='map' style='width: 800px;height: 500px;margin: auto'></div>

<script>


    /**
     * 创建一个Vector的layer来放置图标
     */
    var layer = new ol.layer.Vector({
        source: new ol.source.Vector()
    })

    /**
     *  创建地图
     */
    var map = new ol.Map({

        // 设置地图图层
        layers: [
            //创建一个使用Open Street Map地图源的图层
            new ol.layer.Tile({
                source: new ol.source.OSM()
            }),
            layer
        ],

        // 设置显示地图的视图
        view: new ol.View({
            center: [0, 0],       // 设置地图显示中心于经度0度,纬度0度处
            zoom: 10           // 设置地图显示层级为5
        }),

        // 让id为map的div作为地图的容器
        target: 'map'

    });

    //创建一个Feature,并设置好在地图的位置
    var anchor = new ol.Feature({
        geometry: new ol.geom.Point([0, 0])
    });


    // 设置文字style
    anchor.setStyle(new ol.style.Style({
        text: new ol.style.Text({
            font: '10px sans-serif', //默认这个字体,可以修改成其他的,格式和css的字体设置一样
            text: '你好 OpenLayers 3',
            fill: new ol.style.Fill({
                color: 'red'
            })
        })
    }));

    // 将Feature添加到之前的创建的layer中去
    layer.getSource().addFeature(anchor);


</script>
</body>
</html>
- 1
- 2
- 3
- 4
- 5
- 6
- 7
- 8
- 9
- 10
- 11
- 12
- 13
- 14
- 15
- 16
- 17
- 18
- 19
- 20
- 21
- 22
- 23
- 24
- 25
- 26
- 27
- 28
- 29
- 30
- 31
- 32
- 33
- 34
- 35
- 36
- 37
- 38
- 39
- 40
- 41
- 42
- 43
- 44
- 45
- 46
- 47
- 48
- 49
- 50
- 51
- 52
- 53
- 54
- 55
- 56
- 57
- 58
- 59
- 60
- 61
- 62
- 63
- 64
- 65
- 66
- 67
- 68
- 69
- 70
- 71
- 72
- 73
- 74
2、运行结果
七、styleFunction方式在地图添加图标
1、map7.html
<!Doctype html>
<html xmlns='http://www.w3.org/1999/xhtml'>
<head>
    <meta http-equiv='Content-Type' content='text/html;charset=utf-8'>
    <meta http-equiv='X-UA-Compatible' content='IE=edge,chrome=1'>
    <meta content='always' name='referrer'>
    <title>OpenLayers 3 :文字标注</title>
    <link href='ol.css ' rel='stylesheet' type='text/css'/>
    <script type='text/javascript' src='ol.js' charset='utf-8'></script>
</head>

<body>

<div id='map' style='width: 800px;height: 500px;margin: auto'></div>

<script>


    /**
     * 创建一个Vector的layer来放置图标
     */
    var layer = new ol.layer.Vector({
        source: new ol.source.Vector()
    })


    /**
     *  创建地图
     */
    var map = new ol.Map({

        // 设置地图图层
        layers: [
            //创建一个使用Open Street Map地图源的图层
            new ol.layer.Tile({
                source: new ol.source.OSM()
            }),
            layer
        ],

        // 设置显示地图的视图
        view: new ol.View({
            center: [0, 0],       // 设置地图显示中心于经度0度,纬度0度处
            zoom: 10           // 设置地图显示层级为5
        }),

        // 让id为map的div作为地图的容器
        target: 'map'

    });

    //创建一个Feature,并设置好在地图的位置
    var anchor = new ol.Feature({
        geometry: new ol.geom.Point([0, 0])
    });

    // 应用style function,动态的获取样式
    anchor.setStyle(function(resolution){
        return [new ol.style.Style({
            image: new ol.style.Icon({
                src: 'images/user.png',
                scale: map.getView().getZoom() / 10
            })
        })];
    });

    // 将Feature添加到之前的创建的layer中去
    layer.getSource().addFeature(anchor);


</script>
</body>
</html>
- 1
- 2
- 3
- 4
- 5
- 6
- 7
- 8
- 9
- 10
- 11
- 12
- 13
- 14
- 15
- 16
- 17
- 18
- 19
- 20
- 21
- 22
- 23
- 24
- 25
- 26
- 27
- 28
- 29
- 30
- 31
- 32
- 33
- 34
- 35
- 36
- 37
- 38
- 39
- 40
- 41
- 42
- 43
- 44
- 45
- 46
- 47
- 48
- 49
- 50
- 51
- 52
- 53
- 54
- 55
- 56
- 57
- 58
- 59
- 60
- 61
- 62
- 63
- 64
- 65
- 66
- 67
- 68
- 69
- 70
- 71
- 72
- 73
2、运行结果
声明:本文内容由网友自发贡献,不代表【wpsshop博客】立场,版权归原作者所有,本站不承担相应法律责任。如您发现有侵权的内容,请联系我们。转载请注明出处:https://www.wpsshop.cn/w/花生_TL007/article/detail/728217
推荐阅读
相关标签

