
使用机器学习进行疾病预测 -- 机器学习项目基础篇(3)_机器学习疾病预测
赞
踩
本文旨在实现一个强大的机器学习模型,可以根据他/她所拥有的症状有效地预测人类的疾病。让我们看看如何解决这个机器学习问题:
方法:
- 收集数据:数据准备是任何机器学习问题的主要步骤。我们将使用来自Kaggle的数据集来解决这个问题。该数据集由两个CSV文件组成,一个用于训练,一个用于测试。数据集中总共有133列,其中132列表示症状,最后一列是预后。
- 清理数据:清理是机器学习项目中最重要的一步。数据的质量决定了机器学习模型的质量。因此,在将数据馈送到模型进行训练之前,总是需要清理数据。在我们的数据集中,所有列都是数字列,目标列即预后是字符串类型并且使用标签编码器被编码为数字形式。
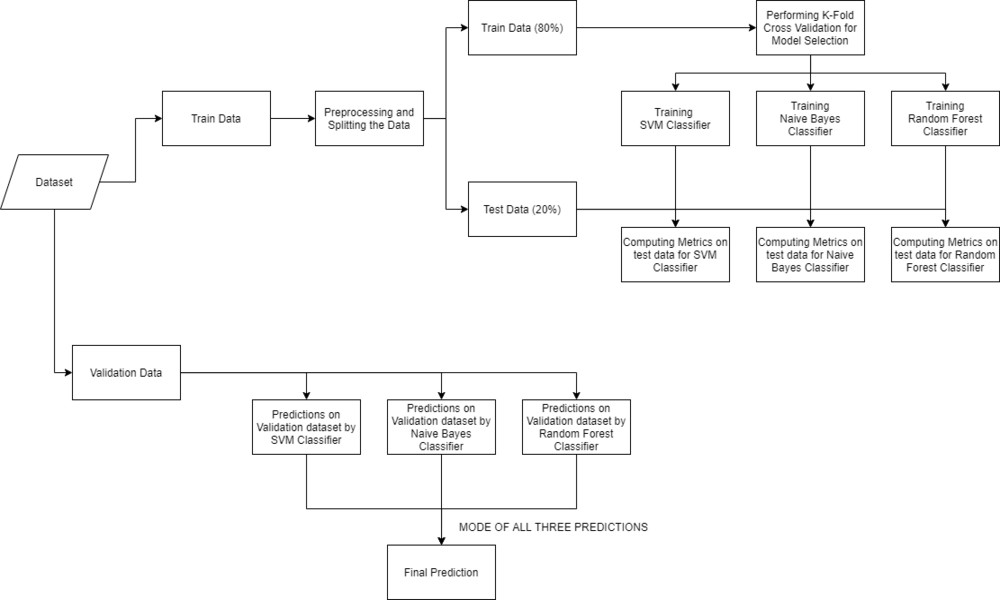
- 模型构建:在收集和清理数据之后,数据就准备好了,可以用来训练机器学习模型。我们将使用这些经过清理的数据来训练支持向量分类器,朴素贝叶斯分类器和随机森林分类器。我们将使用混淆矩阵来确定模型的质量。
- 推断:在训练三个模型之后,我们将通过结合所有三个模型的预测来预测输入症状的疾病。这使得我们的整体预测更加稳健和准确。
最后,我们将定义一个函数,该函数以逗号分隔的症状作为输入,通过使用训练的模型根据症状预测疾病,并以JSON格式返回预测结果。
具体操作
确保下载了Training和Testing,并将train.csv和test.csv放入数据集文件夹中。打开jupyter notebook并单独运行代码以更好地理解。
import numpy as np
import pandas as pd
from scipy.stats import mode
import matplotlib.pyplot as plt
import seaborn as sns
from sklearn.preprocessing import LabelEncoder
from sklearn.model_selection import train_test_split, cross_val_score
from sklearn.svm import SVC
from sklearn.naive_bayes import GaussianNB
from sklearn.ensemble import RandomForestClassifier
from sklearn.metrics import accuracy_score, confusion_matrix

%matplotlib inline
- 1
- 2
- 3
- 4
- 5
- 6
- 7
- 8
- 9
- 10
- 11
- 12
- 13
阅读数据集
首先,我们将使用pandas库从文件夹中加载数据集。在阅读数据集时,我们将删除null列。此数据集是一个干净的数据集,没有空值,所有特征都由0和1组成。每当我们解决分类任务时,有必要检查目标列是否平衡。我们将使用条形图来检查数据集是否平衡。
# Reading the train.csv by removing the
# last column since it's an empty column
DATA_PATH = "dataset/Training.csv"
data = pd.read_csv(DATA_PATH).dropna(axis = 1)

# Checking whether the dataset is balanced or not
disease_counts = data["prognosis"].value_counts()
temp_df = pd.DataFrame({
    "Disease": disease_counts.index,
    "Counts": disease_counts.values
})

plt.figure(figsize = (18,8))
sns.barplot(x = "Disease", y = "Counts", data = temp_df)
plt.xticks(rotation=90)
plt.show()

- 1
- 2
- 3
- 4
- 5
- 6
- 7
- 8
- 9
- 10
- 11
- 12
- 13
- 14
- 15
- 16

从上面的图中,我们可以观察到数据集是平衡的数据集,即每种疾病正好有120个样本,不需要进一步的平衡。我们可以注意到我们的目标列,即预测列是对象数据类型,这种格式不适合训练机器学习模型。因此,我们将使用标签编码器将预测列转换为数值数据类型。标签编码器通过为标签分配唯一索引来将标签转换为数字形式。如果标签的总数是n,则分配给每个标签的数字将在0到n-1之间。
# Encoding the target value into numerical
# value using LabelEncoder
encoder = LabelEncoder()
data["prognosis"] = encoder.fit_transform(data["prognosis"])
- 1
- 2
- 3
- 4
划分数据以训练和测试模型
现在,我们已经通过删除Null值并将标签转换为数字格式来清理数据,现在是时候拆分数据以训练和测试模型了。我们将数据分割为80:20格式,即80%的数据集将用于训练模型,20%的数据将用于评估模型的性能。
X = data.iloc[:,:-1]
y = data.iloc[:, -1]
X_train, X_test, y_train, y_test =train_test_split(
  X, y, test_size = 0.2, random_state = 24)

print(f"Train: {X_train.shape}, {y_train.shape}")
print(f"Test: {X_test.shape}, {y_test.shape}")
- 1
- 2
- 3
- 4
- 5
- 6
- 7
输出:
Train: (3936, 132), (3936,)
Test: (984, 132), (984,)
- 1
- 2
模型建立
分割数据后,我们现在将处理建模部分。我们将使用K-Fold交叉验证来评估机器学习模型。我们将使用支持向量分类器,高斯朴素贝叶斯分类器和随机森林分类器进行交叉验证。在进入实现部分之前,让我们熟悉一下k折交叉验证和机器学习模型。
- K折交叉验证:K-Fold交叉验证是交叉验证技术之一,其中整个数据集被分成k个子集,也称为折叠,然后在k-1个子集上执行模型的训练,剩余的一个子集用于评估模型性能。
- 支持向量分类器:支持向量分类器是一种判别式分类器,即当给定一个标记的训练数据时,该算法试图找到一个最佳的超平面,该超平面准确地将样本分成超空间中的不同类别。
- 高斯朴素贝叶斯分类器:它是一种概率机器学习算法,内部使用贝叶斯定理对数据点进行分类。
- 随机森林分类器:随机森林是一种基于集成学习的监督机器学习分类算法,它在内部使用多个决策树来进行分类。在随机森林分类器中,所有的内部决策树都是弱学习器,并且这些弱决策树的输出被组合,即所有预测的模式作为最终预测。
使用K折交叉验证进行模型选择
# Defining scoring metric for k-fold cross validation
def cv_scoring(estimator, X, y):
    return accuracy_score(y, estimator.predict(X))

# Initializing Models
models = {
    "SVC":SVC(),
    "Gaussian NB":GaussianNB(),
    "Random Forest":RandomForestClassifier(random_state=18)
}

# Producing cross validation score for the models
for model_name in models:
    model = models[model_name]
    scores = cross_val_score(model, X, y, cv = 10,
                             n_jobs = -1,
                             scoring = cv_scoring)
    print("=="*30)
    print(model_name)
    print(f"Scores: {scores}")
    print(f"Mean Score: {np.mean(scores)}")
- 1
- 2
- 3
- 4
- 5
- 6
- 7
- 8
- 9
- 10
- 11
- 12
- 13
- 14
- 15
- 16
- 17
- 18
- 19
- 20
- 21
输出:
============================================================

SVC

Scores: [1. 1. 1. 1. 1. 1. 1. 1. 1. 1.]

Mean Score: 1.0

============================================================

Gaussian NB

Scores: [1. 1. 1. 1. 1. 1. 1. 1. 1. 1.]

Mean Score: 1.0

============================================================

Random Forest

Scores: [1. 1. 1. 1. 1. 1. 1. 1. 1. 1.]

Mean Score: 1.0
- 1
- 2
- 3
- 4
- 5
- 6
- 7
- 8
- 9
- 10
- 11
- 12
- 13
- 14
- 15
- 16
- 17
- 18
- 19
- 20
- 21
- 22
- 23
从上面的输出中,我们可以注意到,我们所有的机器学习算法都表现得非常好,k折交叉验证后的平均分数也非常高。为了建立一个强大的模型,我们可以联合采用所有三个模型的预测模式,使得即使其中一个模型做出错误的预测,而另外两个模型做出正确的预测,那么最终的输出将是正确的。这种方法将帮助我们在完全看不见的数据上保持预测更加准确。在下面的代码中,我们将在训练数据上训练所有三个模型,使用混淆矩阵检查模型的质量,然后联合所有三个模型的预测。
通过组合所有模型构建鲁棒分类器:
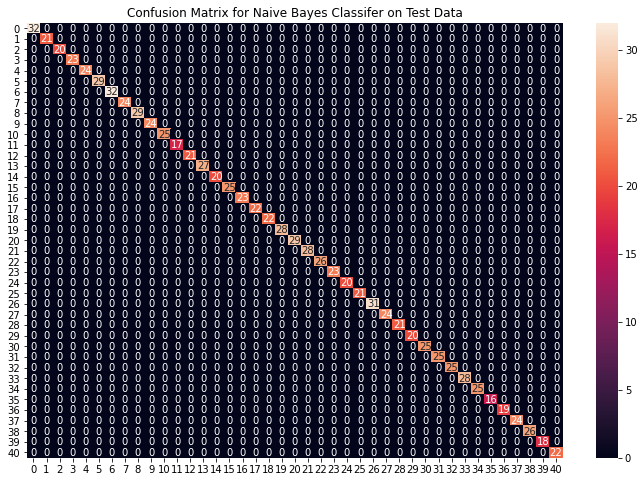
# Training and testing SVM Classifier
svm_model = SVC()
svm_model.fit(X_train, y_train)
preds = svm_model.predict(X_test)

print(f"Accuracy on train data by SVM Classifier\
: {accuracy_score(y_train, svm_model.predict(X_train))*100}")

print(f"Accuracy on test data by SVM Classifier\
: {accuracy_score(y_test, preds)*100}")
cf_matrix = confusion_matrix(y_test, preds)
plt.figure(figsize=(12,8))
sns.heatmap(cf_matrix, annot=True)
plt.title("Confusion Matrix for SVM Classifier on Test Data")
plt.show()

# Training and testing Naive Bayes Classifier
nb_model = GaussianNB()
nb_model.fit(X_train, y_train)
preds = nb_model.predict(X_test)
print(f"Accuracy on train data by Naive Bayes Classifier\
: {accuracy_score(y_train, nb_model.predict(X_train))*100}")

print(f"Accuracy on test data by Naive Bayes Classifier\
: {accuracy_score(y_test, preds)*100}")
cf_matrix = confusion_matrix(y_test, preds)
plt.figure(figsize=(12,8))
sns.heatmap(cf_matrix, annot=True)
plt.title("Confusion Matrix for Naive Bayes Classifier on Test Data")
plt.show()

# Training and testing Random Forest Classifier
rf_model = RandomForestClassifier(random_state=18)
rf_model.fit(X_train, y_train)
preds = rf_model.predict(X_test)
print(f"Accuracy on train data by Random Forest Classifier\
: {accuracy_score(y_train, rf_model.predict(X_train))*100}")

print(f"Accuracy on test data by Random Forest Classifier\
: {accuracy_score(y_test, preds)*100}")

cf_matrix = confusion_matrix(y_test, preds)
plt.figure(figsize=(12,8))
sns.heatmap(cf_matrix, annot=True)
plt.title("Confusion Matrix for Random Forest Classifier on Test Data")
plt.show()
- 1
- 2
- 3
- 4
- 5
- 6
- 7
- 8
- 9
- 10
- 11
- 12
- 13
- 14
- 15
- 16
- 17
- 18
- 19
- 20
- 21
- 22
- 23
- 24
- 25
- 26
- 27
- 28
- 29
- 30
- 31
- 32
- 33
- 34
- 35
- 36
- 37
- 38
- 39
- 40
- 41
- 42
- 43
- 44
- 45
- 46
输出:
Accuracy on train data by SVM Classifier: 100.0
Accuracy on test data by SVM Classifier: 100.0
- 1
- 2

Accuracy on train data by Naive Bayes Classifier: 100.0
Accuracy on test data by Naive Bayes Classifier: 100.0
- 1
- 2
Accuracy on train data by Random Forest Classifier: 100.0
Accuracy on test data by Random Forest Classifier: 100.0
- 1
- 2

从上面的混淆矩阵,我们可以看到模型在看不见的数据上表现得非常好。现在,我们将在我们下载的数据集中的整个训练数据上训练模型,然后在数据集中的测试数据上测试我们的组合模型。
在整个数据上拟合模型并在测试数据集上验证:
# Training the models on whole data
final_svm_model = SVC()
final_nb_model = GaussianNB()
final_rf_model = RandomForestClassifier(random_state=18)
final_svm_model.fit(X, y)
final_nb_model.fit(X, y)
final_rf_model.fit(X, y)

# Reading the test data
test_data = pd.read_csv("./dataset/Testing.csv").dropna(axis=1)

test_X = test_data.iloc[:, :-1]
test_Y = encoder.transform(test_data.iloc[:, -1])

# Making prediction by take mode of predictions
# made by all the classifiers
svm_preds = final_svm_model.predict(test_X)
nb_preds = final_nb_model.predict(test_X)
rf_preds = final_rf_model.predict(test_X)

final_preds = [mode([i,j,k])[0][0] for i,j,
			k in zip(svm_preds, nb_preds, rf_preds)]

print(f"Accuracy on Test dataset by the combined model\
: {accuracy_score(test_Y, final_preds)*100}")

cf_matrix = confusion_matrix(test_Y, final_preds)
plt.figure(figsize=(12,8))

sns.heatmap(cf_matrix, annot = True)
plt.title("Confusion Matrix for Combined Model on Test Dataset")
plt.show()
- 1
- 2
- 3
- 4
- 5
- 6
- 7
- 8
- 9
- 10
- 11
- 12
- 13
- 14
- 15
- 16
- 17
- 18
- 19
- 20
- 21
- 22
- 23
- 24
- 25
- 26
- 27
- 28
- 29
- 30
- 31
- 32
输出:
Accuracy on Test dataset by the combined model: 100.0
- 1

我们可以看到,我们的组合模型准确地分类了所有数据点。我们已经到了整个实现的最后一部分,我们将创建一个函数,该函数将逗号分隔的症状作为输入,并使用基于输入症状的组合模型输出预测的疾病。
创建一个可以将症状作为输入并生成疾病预测的函数
symptoms = X.columns.values

# Creating a symptom index dictionary to encode the
# input symptoms into numerical form
symptom_index = {}
for index, value in enumerate(symptoms):
	symptom = " ".join([i.capitalize() for i in value.split("_")])
	symptom_index[symptom] = index

data_dict = {
	"symptom_index":symptom_index,
	"predictions_classes":encoder.classes_
}

# Defining the Function
# Input: string containing symptoms separated by commas
# Output: Generated predictions by models
def predictDisease(symptoms):
	symptoms = symptoms.split(",")

	# creating input data for the models
	input_data = [0] * len(data_dict["symptom_index"])
	for symptom in symptoms:
		index = data_dict["symptom_index"][symptom]
		input_data[index] = 1

	# reshaping the input data and converting it
	# into suitable format for model predictions
	input_data = np.array(input_data).reshape(1,-1)

	# generating individual outputs
	rf_prediction = data_dict["predictions_classes"][final_rf_model.predict(input_data)[0]]
	nb_prediction = data_dict["predictions_classes"][final_nb_model.predict(input_data)[0]]
	svm_prediction = data_dict["predictions_classes"][final_svm_model.predict(input_data)[0]]

	# making final prediction by taking mode of all predictions
	final_prediction = mode([rf_prediction, nb_prediction, svm_prediction])[0][0]
	predictions = {
		"rf_model_prediction": rf_prediction,
		"naive_bayes_prediction": nb_prediction,
		"svm_model_prediction": svm_prediction,
		"final_prediction":final_prediction
	}
	return predictions

# Testing the function
print(predictDisease("Itching,Skin Rash,Nodal Skin Eruptions"))
- 1
- 2
- 3
- 4
- 5
- 6
- 7
- 8
- 9
- 10
- 11
- 12
- 13
- 14
- 15
- 16
- 17
- 18
- 19
- 20
- 21
- 22
- 23
- 24
- 25
- 26
- 27
- 28
- 29
- 30
- 31
- 32
- 33
- 34
- 35
- 36
- 37
- 38
- 39
- 40
- 41
- 42
- 43
- 44
- 45
- 46
- 47
输出:
{
    'rf_model_prediction': 'Fungal infection',
    'naive_bayes_prediction': 'Fungal infection',
    'svm_model_prediction': 'Fungal infection',
    'final_prediction': 'Fungal infection'
}
- 1
- 2
- 3
- 4
- 5
- 6
注:作为函数输入的症状在数据集中的132个症状中应该完全相同。

