- 1SpringBoot整合SpringSecurity+JWT实现web应用中的认证和授权_spring security 整合
- 2无服务器开发实例|微服务向无服务器架构演进的探索
- 3数据库(Mysql)的四种隔离级别_mysql事务隔离级别
- 4服务 300+ 出海客户实践总结,神策数据助力 AI 出海实现高增长
- 5hivesql 将json格式字符串转为数组_hive json转数组
- 6SQL Server语法规则及示例_sql server语言范例参考
- 7物联网中的ESP8266该这么用!_esp82666 连接sd卡
- 8Linux打包python(pyinstaller)及问题解决_linux pyinstaller
- 9android 时间设置控件的值,Android 中的时间日期控件
- 10tensorflow——模型迁移_模型迁移 节点优化 节点合并 tensorflow
(11-4)基于大模型的情感分析系统(Tensorflow+BERT+RoBERTa+Sklearn):数据探索_用大模型实现情感分析
赞
踩

假期结束,聚餐结束
11.6 数据探索
在这个项目中,数据探索的功能主要包括对文本数据的详细清洗和分析。通过处理文本、统计文本长度、进行标签编码等步骤,深入了解了数据的特征和分布。这为后续建模和情感分析任务提供了基础,确保了模型训练和评估的可靠性。
11.6.1 数据预处理
(1)使用Pandas库中的read_csv函数从CSV文件中读取数据,并将结果存储在DataFrame对象中。df包含了从名为'Corona_NLP_train.csv'的文件中读取的训练数据,而df_test包含了从'Corona_NLP_test.csv'中读取的测试数据。在读取时,指定了编码方式为'ISO-8859-1'。
- df = pd.read_csv('covid-19-nlp-text-classification/Corona_NLP_train.csv', encoding='ISO-8859-1')
- df_test = pd.read_csv('covid-19-nlp-text-classification/Corona_NLP_test.csv')
注意:在使用Pandas的read_csv函数加载数据集时,UTF-8编码无法正常工作。因此,我们采用了'ISO-8859-1'/latin-1编码。后续发现一些特殊字符,如撇号,被转换为'\x92',这将在数据清理过程中进行处理。
(2)通过函数df.head()显示该数据框的前几行数据。这是一种快速查看数据的方式,以确保数据正确加载。
df.head()执行这个方法后,会输出显示数据框的前几行,默认是前五行。
- UserName ScreenName Location TweetAt OriginalTweet Sentiment
- 0 3799 48751 London 16-03-2020 @MeNyrbie @Phil_Gahan @Chrisitv https://t.co/i... Neutral
- 1 3800 48752 UK 16-03-2020 advice Talk to your neighbours family to excha... Positive
- 2 3801 48753 Vagabonds 16-03-2020 Coronavirus Australia: Woolworths to give elde... Positive
- 3 3802 48754 NaN 16-03-2020 My food stock is not the only one which is emp... Positive
- 4 3803 48755 NaN 16-03-2020 Me, ready to go at supermarket during the #COV... Extremely Negative
(3)通过函数df.info()显示关于数据框的一些基本信息,包括每列的非空值数量、数据类型以及内存占用情况等。
df.info()执行后会输出:
- <class 'pandas.core.frame.DataFrame'>
- RangeIndex: 41157 entries, 0 to 41156
- Data columns (total 6 columns):
- # Column Non-Null Count Dtype
- --- ------ -------------- -----
- 0 UserName 41157 non-null int64
- 1 ScreenName 41157 non-null int64
- 2 Location 32567 non-null object
- 3 TweetAt 41157 non-null object
- 4 OriginalTweet 41157 non-null object
- 5 Sentiment 41157 non-null object
- dtypes: int64(2), object(4)
- memory usage: 1.9+ MB
(5)将 DataFrame 中的 'TweetAt' 列转换为 Pandas 的日期时间格式,以便在后续的分析中更方便地处理日期数据。
df['TweetAt'] = pd.to_datetime(df['TweetAt'])(6)处理重复数据
处理重复数据通常是数据清理的一部分,以确保在分析和建模过程中不会出现重复的信息,从而避免对结果产生不必要的影响。在数据预处理阶段,可以采取措施删除或合并这些重复的微博。下面两行代码的作用是删除 DataFrame 中基于 'OriginalTweet' 列的重复行,并更新 DataFrame。
- df.drop_duplicates(subset='OriginalTweet',inplace=True)
- df.info()
总体而言,这段代码的目的是从 DataFrame 中删除基于 'OriginalTweet' 列内容重复的行,并查看更新后的 DataFrame 信息。对上述代码的具体说明如下所示:
- df.drop_duplicates(subset='OriginalTweet', inplace=True):使用 Pandas 的 drop_duplicates 方法,通过指定 'OriginalTweet' 列,删除基于该列内容重复的行。inplace=True 表示在原始 DataFrame 上进行修改,而不是返回一个新的 DataFrame。
- df.info():输出更新后的 DataFrame 的基本信息,包括每列的非空值数量、数据类型等,此行代码可能用于确认删除重复行后的数据集信息。
执行后会输出:
- <class 'pandas.core.frame.DataFrame'>
- Int64Index: 41157 entries, 0 to 41156
- Data columns (total 6 columns):
- # Column Non-Null Count Dtype
- --- ------ -------------- -----
- 0 UserName 41157 non-null int64
- 1 ScreenName 41157 non-null int64
- 2 Location 32567 non-null object
- 3 TweetAt 41157 non-null datetime64[ns]
- 4 OriginalTweet 41157 non-null object
- 5 Sentiment 41157 non-null object
- dtypes: datetime64[ns](1), int64(2), object(3)
- memory usage: 2.2+ MB
11.6.2 数据统计
(1)按日期统计数据数量
下面代码首先将 'TweetAt' 列中的日期转换为“月-日”格式,然后使用 value_counts 统计每个日期的微博数量,并按日期升序排序。接着,通过 sns.barplot 绘制了一个条形图,展示了每个日期的微博数量。图表的标题为 '按日期统计微博数量',y轴标签为 '数量',并采用了蓝色调的颜色。最后,使用 plt.show() 显示图表。
- tweets_per_day = df['TweetAt'].dt.strftime('%m-%d').value_counts().sort_index().reset_index(name='counts')
- plt.figure(figsize=(20, 5))
- ax = sns.barplot(x='index', y='counts', data=tweets_per_day, edgecolor='black', ci=False, palette='Blues_r')
- plt.title('按日期统计微博数量')
- plt.yticks([])
- ax.bar_label(ax.containers[0])
- plt.ylabel('数量')
- plt.xlabel('')
- plt.show()
执行后会绘制一个按日期统计微博数据数量的条形图,效果如图11-2所示。在这个图表中,横轴表示日期,纵轴表示微博的数量。每个条形的高度表示相应日期的微博数量。这种图表通常用于展示随时间变化的趋势,帮助观察微博数量的分布和波动。
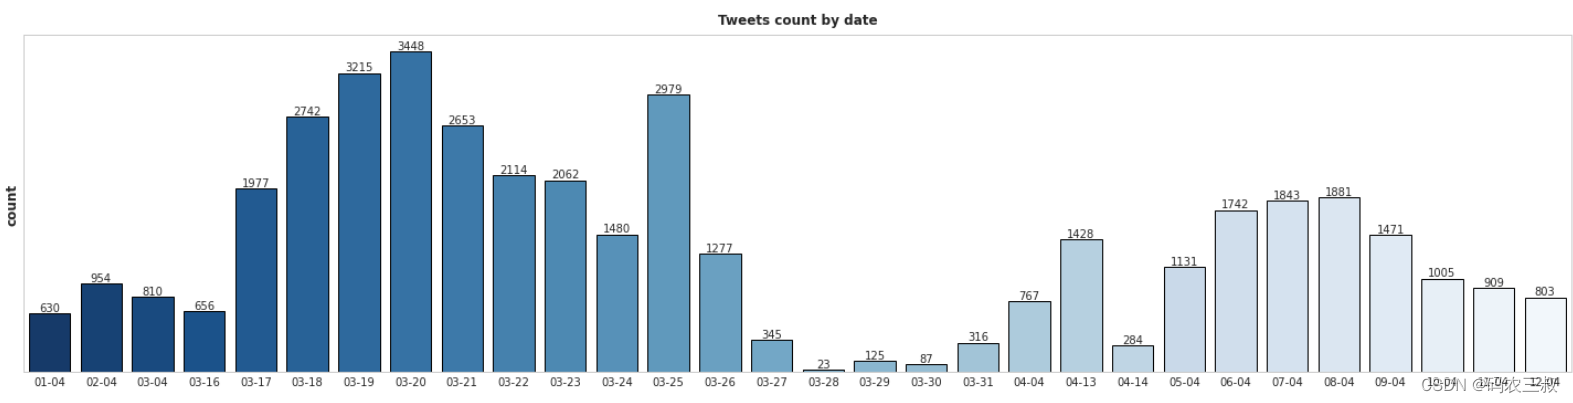
图11-2 执行效果
我们注意到数据集中存在一些日期没有微博数据。在有微博的日期中,大多数微博集中在三月底:从3月18日到3月26日。
(2)统计每个区域的微博数量
下面这段代码首先通过对 'Location' 列进行值计数,筛选出微博数量超过100的区域,并将结果存储在 tweets_per_country 中。接着,使用 sns.barplot 绘制了一个条形图,横轴表示区域,纵轴表示微博数量。可视化图的标题为 'Tweets count ',并采用了Spectral颜色调。横轴标签旋转70度,以避免文字重叠。最后,使用 plt.show()显示绘制的可视化图。
- tweets_per_country = df['Location'].value_counts().loc[lambda x : x > 100].reset_index(name='counts')
- plt.figure(figsize=(15,6))
- ax = sns.barplot(x='index', y='counts', data=tweets_per_country,edgecolor = 'black',ci=False, palette='Spectral')
- plt.title('Tweets count')
- plt.xticks(rotation=70)
- plt.yticks([])
- ax.bar_label(ax.containers[0])
- plt.ylabel('count')
- plt.xlabel('')
- plt.show()
执行后绘制了一个按区域统计微博数量的条形图,如图11-3所示。其中横轴表示区域,纵轴表示每个区域的微博数量。每个条形的高度表示相应区域的微博数量。图表采用了Spectral颜色调,通过横轴标签旋转70度,以避免文字重叠。这个图表有助于观察不同国家之间的微博分布情况,特别是筛选出微博数量超过100的国家。
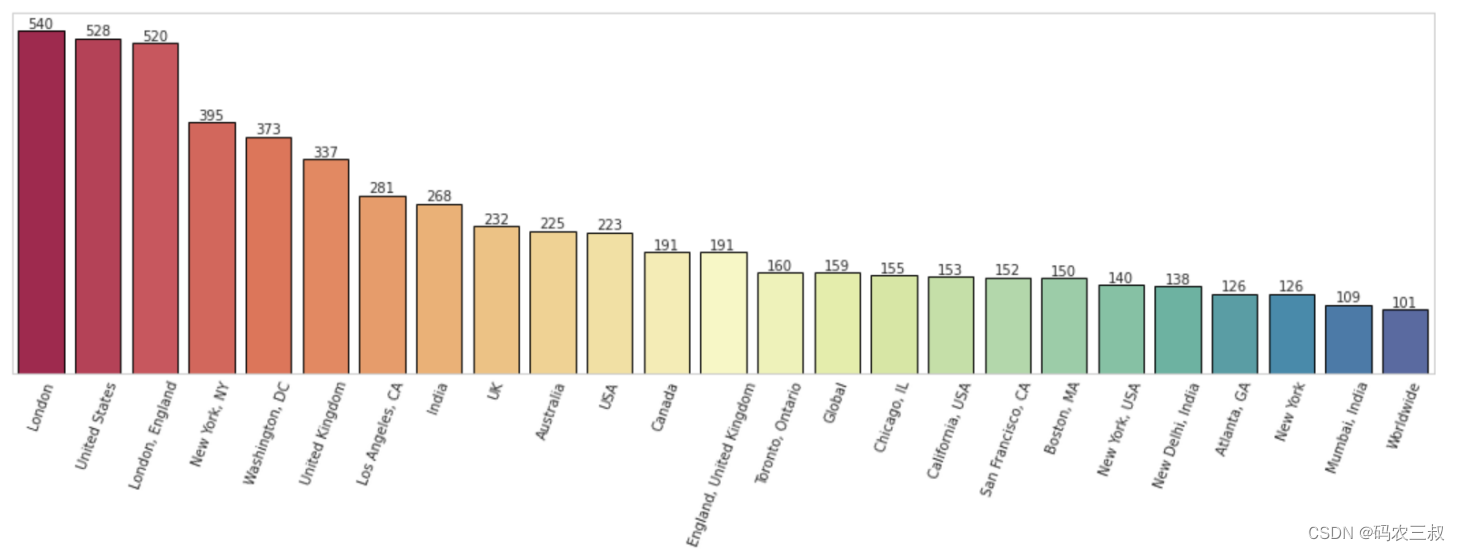
图11-3 按地区统计微博数量的条形图
未完待续