
热门标签
热门文章
- 12024生成式AI赋能教育未来白皮书
- 2python数据处理与分析案例,python如何进行数据处理
- 3【人工智能AI】InstructGPT介绍:OpenAI 引入 InstructGPT 语言模型以遵循人类指令_instructgpt: text generation with plug-in instruct
- 42020多益校招秋招(互联网产品研发工程师)笔试题_多益网络校招笔试题软件工程师
- 5java面经合集(面试遇到的)_杭州全诊医学 java面经
- 6当“广撒网”遇上“精准定点”的鱼叉式网络钓鱼
- 7Adam原理详解 Adam和SGD之间的主要区别是什么?
- 890后被裁员、再入职阿里年薪50万:为什么我劝你早点学会这项技能_阿里c员完再入职的会不会是这样的:50woffer入职阿里。拿到杭州市e类人才认证
- 9unity发布webgl开发记录
- 10springboot整合kafka_springboot kafka starter
当前位置: article > 正文
uniapp微信小程序使用echarts_uni-app微信小程序使用echarts
作者:神奇cpp | 2024-07-24 06:05:39
赞
踩
uni-app微信小程序使用echarts
uni组件中无法引入uni-ec-canvas,或者引入uni-ec-canvas后也没有此依赖包,此时我们可以写组件来引用渲染。
1、引入组件
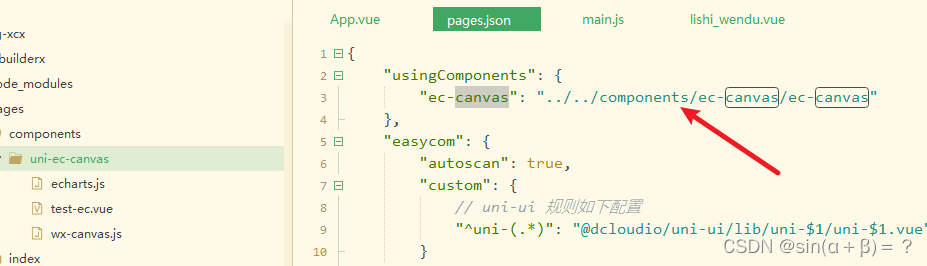
在pages.json中引入该组件
- "usingComponents": {
- "ec-canvas": "../../components/ec-canvas/ec-canvas"
- },
在要使用echarts图的页面引入组件

详细代码如下
- <template>
- <view class="body">
- <u-ec-canvas class="uni-ec-canvas" id="uni-ec-canvas" ref="canvas" canvas-id="uni-ec-canvas" :ec="ec">
- </u-ec-canvas>
- </view>
- </template>
-
- <script>
- import uEcCanvas from '../components/uni-ec-canvas/test-ec.vue'
- import * as echarts from '../components/uni-ec-canvas/echarts.js'
-
- let chart = null
-
- export default {
- components: {
- uEcCanvas
- },
- mounted() {
- this.getData()
- },
- onUnload() {
- echarts.dispose(this.$refs.canvas);
- },
- methods: {
- initChart(canvas, width, height, canvasDpr) {
- chart = echarts.init(canvas, null, {
- width: width,
- height: height,
- devicePixelRatio: canvasDpr,
- resize: true
- })
- let option = {
- xAxis: {
- type: 'category',
- data: this.xdata,
- axisLabel: {
- rotate: -45, // 设置 x 轴标签旋转角度为 -45 度
- }
- },
- yAxis: [
- {
- type: 'value',
- name: "℃",
- // min: 10
- },
- {
- type: 'value',
- name: "湿度",
- }
- ],
- series: [
- {
- name: "温度",
- data: this.ydata,
- type: 'line',
- smooth: true,
- itemStyle: {
- normal: {
- color: "#00aaff"
- }
- },
- areaStyle: {
- color: 'rgba(0, 170, 255, 0.2)'
- }
- },
- {
- name: "湿度",
- data: this.y2data,
- type: 'line',
- smooth: true,
- itemStyle: {
- normal: {
- color: "#ff0000" // 设置第二条线的颜色
- }
- },
- areaStyle: {
- color: 'rgba(255, 0, 0, 0.2)' // 设置第二条线的区域颜色
- },
- yAxisIndex: 1 // 将第二条线的 y 轴设置为右边的 y 轴
- }
- ],
- legend: {
- data: ['温度', '湿度'] // 设置图例名称
- },
- tooltip: {
- trigger: 'axis', // 设置触发类型为坐标轴触发
- // axisPointer: {
- // type: 'cross' // 设置指示器类型为十字准星
- // },
- showContent: true, // 显示 Tooltip 内容
- showDelay: 0, // 鼠标移入后立即显示
- hideDelay: 0, // 鼠标移出后立即隐藏
- triggerOn: 'click', // 设置触发方式为点击
- hideOn: 'mouseout', // 鼠标移出时隐藏 Tooltip
- formatter: function(params) {
- return `时间: ${params[0].name}
- ${params[0].seriesName}: ${params[0].value}
- ${params[1].seriesName}: ${params[1].value}`
- }
- },
- dataZoom: [
- {
- type: 'slider',
- show: true,
- start: 0,
- end: 10 / this.xdata.length * 100, // 默认显示最后10条数据
- handleSize: 8,
- height: 2,
- top: '90%'
- },
- {
- type: 'inside',
- start: 0,
- end: 10 / this.xdata.length * 100, // 默认显示最后10条数据
- height: 2
- }
- ]
- }
- canvas.setChart(chart)
- chart.setOption(option)
- return chart
- },
- }

2、echarts.js包太大,小程序不能上传
echarts的包太大,我们可以在echarts的构建工具中选择自己需要的吗,模版工具进行打包
下载后替换文件中的echarts.js文件,并将自己下载的文件替换成echarts.js文件名,否则引入会找不到文件。
3、上传代码时,包还是太大,怎么解决
如果到最后,包文件超过2M,无法上传
我们可以尝试:
1.分包
2.静态文件,例如图片等,使用网络地址
3.在上传代码时,勾选“自动压缩脚本文件”

声明:本文内容由网友自发贡献,不代表【wpsshop博客】立场,版权归原作者所有,本站不承担相应法律责任。如您发现有侵权的内容,请联系我们。转载请注明出处:https://www.wpsshop.cn/w/神奇cpp/article/detail/873271
推荐阅读
相关标签

