- 1chatgpt赋能python:Python加速读取CSV文件的方法_python 读取csv提速
- 2需要考虑的3种软件测试方法-瀑布方法_信息化 瀑布法
- 3【数据结构】一文带你全面了解排序(上)——直接插入排序、希尔排序、选择排序、堆排序
- 4Druid对数据库密码加密_dorado7用户密码加密
- 5决策树算法小结(三) CART原理及代码实现
- 6时间复杂度空间复杂度相关练习题_时间复杂度题库
- 7maven导入Gson_maven gson
- 8Kafka实战——简单易懂的生产者消费者demo_kafka demo
- 9自动化代码质量检测平台sonarqube搭建及使用,以及集成gitlab ci提交自动返回结果
- 10从日志入手,基金公司应该这样实现合规!
python︱写markdown一样写网页,代码快速生成web工具:streamlit介绍(一)
赞
踩
系列参考:
python︱写markdown一样写网页,代码快速生成web工具:streamlit介绍(一)
python︱写markdown一样写网页,代码快速生成web工具:streamlit 重要组件介绍(二)
python︱写markdown一样写网页,代码快速生成web工具:streamlit 展示组件(三)
python︱写markdown一样写网页,代码快速生成web工具:streamlit lay-out布局(四)
python︱写markdown一样写网页,代码快速生成web工具:streamlit 缓存(五)
python︱写markdown一样写网页,代码快速生成web工具:streamlit 数据探索案例(六)
streamlit + opencv/YOLOv3 快速构建自己的图像目标检测demo网页(七)
github代码链接:mattzheng/streamlit_demo
1 streamlit介绍
Streamlit 网站:https://streamlit.io/
GitHub地址:https://github.com/streamlit/streamlit/
参考机器之心的:从Python代码到APP,你只需要一个小工具:GitHub已超3000星
自行构建工具的流程:部署 Flask app,写 HTML、CSS 和 JavaScript,尝试对从 notebook 到样式表的所有一些进行版本控制。
写此类工具感觉就像训练神经网络或者在 Jupyter 中执行点对点分析(ad-hoc analysis)!同时,我们还想保留强大 app 框架的灵活性。我们想创造出令工程师骄傲的好工具。
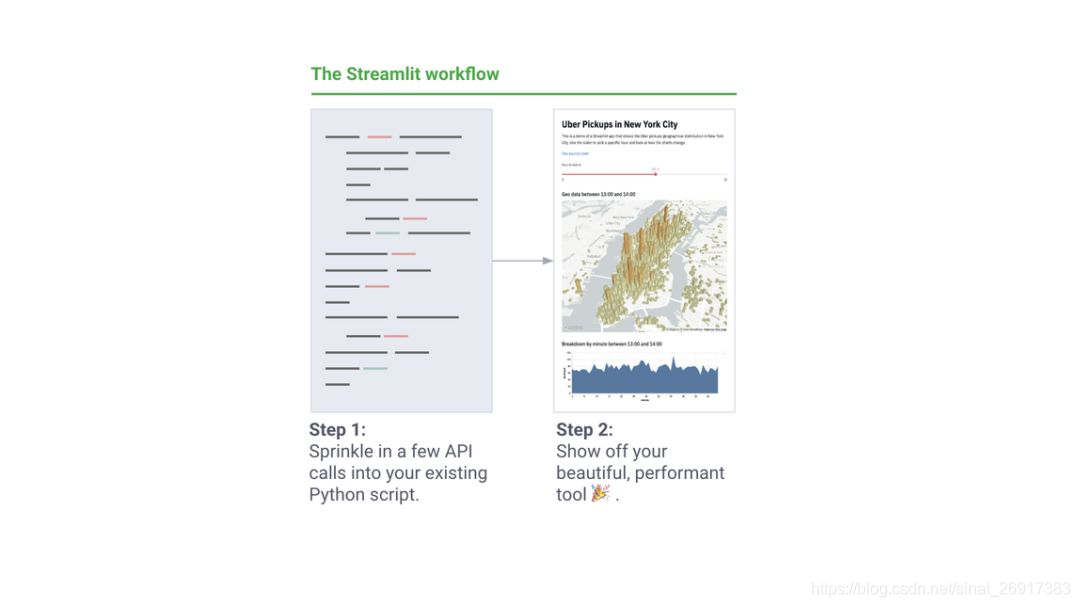
我们希望的 app 构建流程如下:
Streamlit 的核心原则如下:
- 拥抱 Python
Streamlit app 是完全自上而下运行的脚本,没有隐藏状态。你可以利用函数调用来处理代码。只要你会写 Python 脚本,你就可以写 Streamlit app。例如,你可以按照以下代码对屏幕执行写入操作:
import streamlit as stst.write('Hello, world!')
- 1

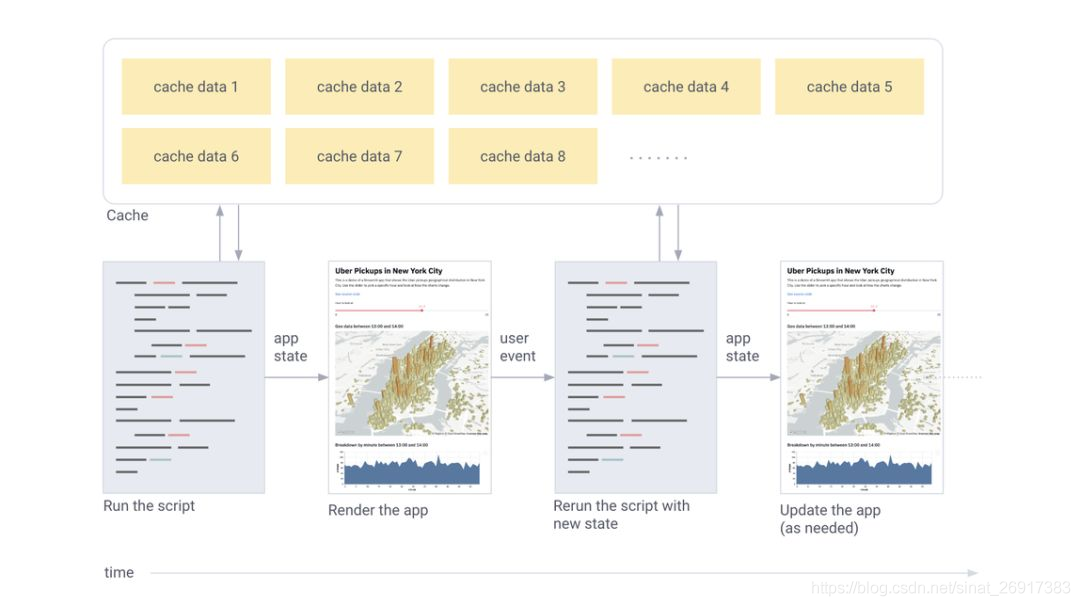
简而言之,Streamlit 的工作流程如下:
每次用户交互均需要从头运行全部脚本。
Streamlit 根据 widget 状态为每个变量分配最新值。
缓存保证 Streamlit 重用数据和计算。
2 安装streamlit
2.1 install
pip install streamlit
streamlit hello
- 1
- 2
这里streamlit可以带你到一个help界面,连接到streamlit一些关联页面里面。
之后,直接运行.py文件就可以了:
streamlit run [filename]
- 1
运行之后,就会自动生成网页:http://localhost:8502/,直接浏览器访问即可
还有更牛逼的打开方式就是,.py可以直接用网上的,太厉害了:
streamlit run https://raw.githubusercontent.com/streamlit/demo-uber-nyc-pickups/master/app.py
- 1
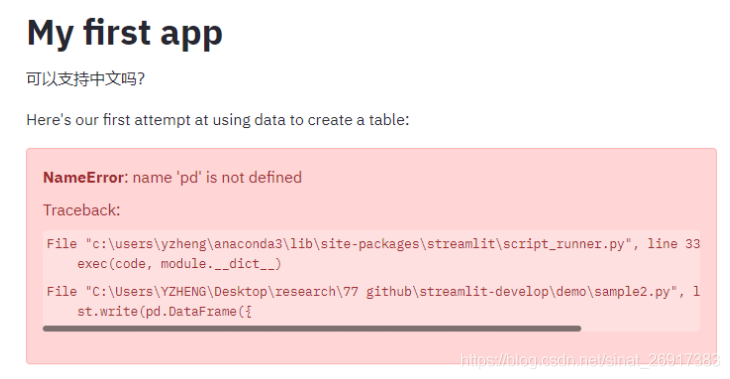
可以支持中文,很友好呀:

而且只要保存文件,不用重启api就可以直接反应上来,非常方便,同时如果运行有报错,就会如下面这般显示:
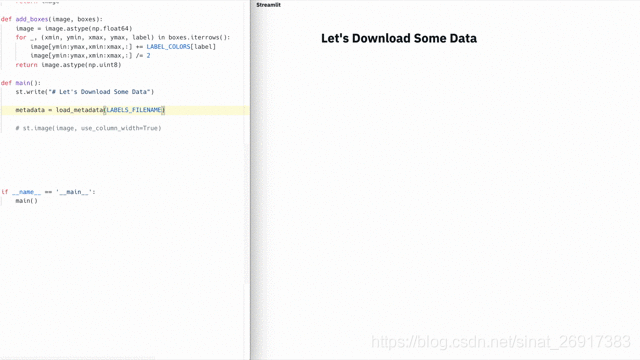
可以把steamlit当作一种IDE:
While developing a Streamlit app, it’s recommended to lay out your editor and browser windows side by side, so the code and the app can be seen at the same time. Give it a try!
当您用@st标记一个函数时。
缓存装饰器,它告诉Streamlit无论何时调用函数都需要检查以下几件事:
- 调用函数时使用的输入参数
- 函数中使用的任何外部变量的值
- 函数体
- 缓存函数中使用的任何函数的函数体
如果这是Streamlit第一次看到这四个组件具有这些精确的值并以这种精确的组合和顺序,那么它将运行该函数并将结果存储在本地缓存中。
然后,下次调用缓存的函数时,如果这些组件都没有更改,Streamlit将直接跳过执行该函数,而是返回先前存储在缓存中的输出。
2.2 其他安装报错
    create_key=_descriptor._internal_create_key,
AttributeError: module 'google.protobuf.descriptor' has no attribute '_internal_create_key'
- 1
- 2
参考教程:
https://blog.csdn.net/Jwenxue/article/details/107240444
可以使用如下pip安装命令对protobuf升级:
pip install --upgrade protobuf -i https://pypi.douban.com/simple
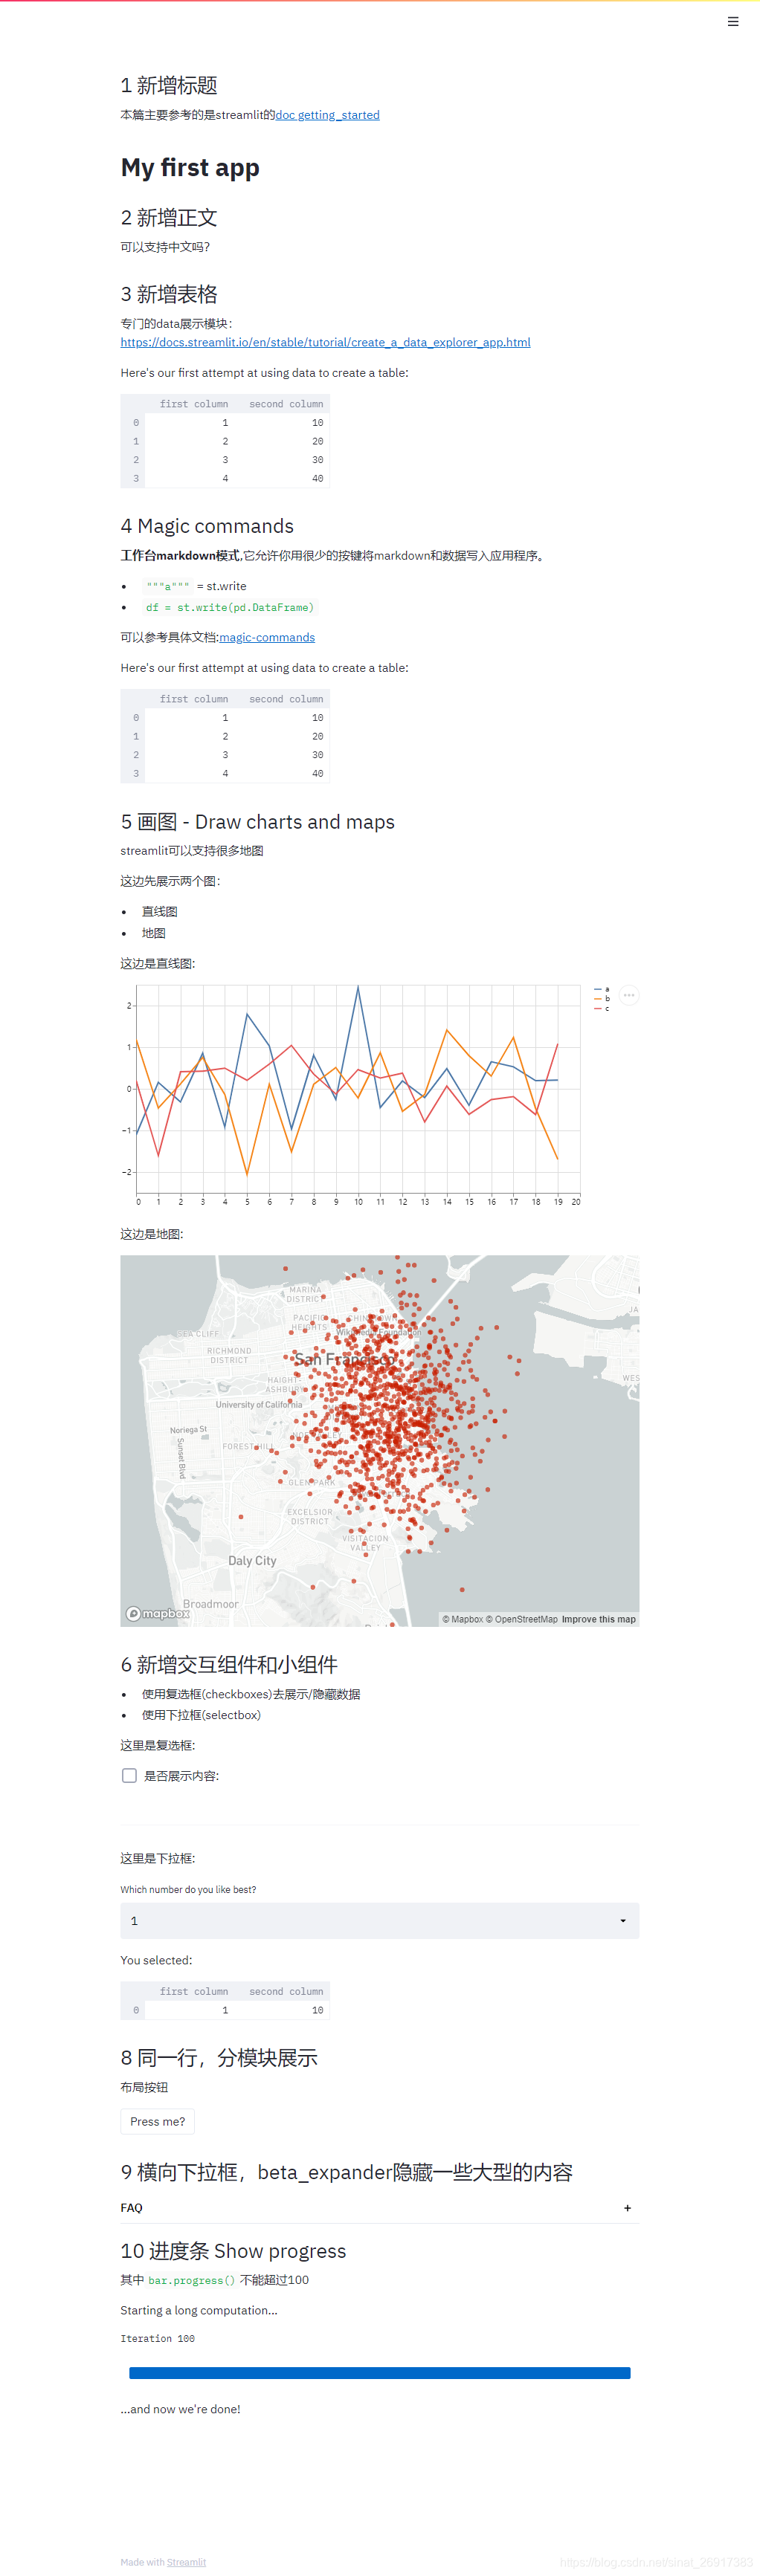
3 快速开始
import streamlit as st
import pandas as pd
import numpy as np


'''
## 1 新增标题

本篇主要参考的是streamlit的[doc getting_started ](https://docs.streamlit.io/en/stable/getting_started.html)

'''

st.title('My first app')

'''
## 2 新增正文
'''

st.write('可以支持中文吗?')

'''
## 3 新增表格

专门的data展示模块:https://docs.streamlit.io/en/stable/tutorial/create_a_data_explorer_app.html
'''

st.write("Here's our first attempt at using data to create a table:")
st.write(pd.DataFrame({
    'first column': [1, 2, 3, 4],
    'second column': [10, 20, 30, 40]
}))

'''
## 4 Magic commands

**工作台markdown模式**,它允许你用很少的按键将markdown和数据写入应用程序。


- `"""a"""` = st.write
- `df = st.write(pd.DataFrame)`

可以参考具体文档:[magic-commands](https://docs.streamlit.io/en/stable/api.html#magic-commands)


Here's our first attempt at using data to create a table:
'''

df = pd.DataFrame({
  'first column': [1, 2, 3, 4],
  'second column': [10, 20, 30, 40]
})

df

'''
## 5 画图 - Draw charts and maps

streamlit可以支持很多地图

这边先展示两个图:
- 直线图
- 地图

'''

st.write("这边是直线图:")
chart_data = pd.DataFrame(
    np.random.randn(20, 3),
    columns=['a', 'b', 'c'])

st.line_chart(chart_data)

st.write("这边是地图:")
map_data = pd.DataFrame(
    np.random.randn(1000, 2) / [50, 50] + [37.76, -122.4],
    columns=['lat', 'lon'])

st.map(map_data)


'''
## 6 新增交互组件和小组件

- 使用复选框(checkboxes)去展示/隐藏数据
- 使用下拉框(selectbox)

'''
st.write("这里是复选框:")
if st.checkbox('是否展示内容:'):
    chart_data = pd.DataFrame(
       np.random.randn(20, 3),
       columns=['a', 'b', 'c'])

    st.line_chart(chart_data)


'''
---
'''

st.write("这里是下拉框:")
option = st.selectbox(
    'Which number do you like best?',
      df['first column'])

'You selected: ', df[df['first column'] == option]


# '''
# ## 7 布局你的app

# 与下拉框只能存在一个

# - 下拉框在页面的左边,不跟上面的一样,瀑布流累计
# '''
# option = st.sidebar.selectbox(
#     'Which number do you like best?',
#      df['first column'])

# 'You selected:', option

'''
## 8 同一行,分模块展示
布局按钮
'''
left_column,middle_column, right_column = st.beta_columns(3)
pressed = left_column.button('Press me?')
if pressed:
    right_column.write("哈哈,别乱点!")
    middle_column.write("我在中间!")


'''
## 9 横向下拉框,beta_expander隐藏一些大型的内容
'''
expander = st.beta_expander("FAQ")
expander.write(df[df['first column'] == option])
expander.write("选项二")


'''
## 10 进度条 Show progress

其中`bar.progress()`不能超过100

'''

import time

'Starting a long computation...'

# Add a placeholder
latest_iteration = st.empty()
bar = st.progress(0)

for i in range(100):
  # Update the progress bar with each iteration.
  latest_iteration.text(f'Iteration {i+1}')
  bar.progress(i + 1)
  time.sleep(0.1)

'...and now we\'re done!'

- 1
- 2
- 3
- 4
- 5
- 6
- 7
- 8
- 9
- 10
- 11
- 12
- 13
- 14
- 15
- 16
- 17
- 18
- 19
- 20
- 21
- 22
- 23
- 24
- 25
- 26
- 27
- 28
- 29
- 30
- 31
- 32
- 33
- 34
- 35
- 36
- 37
- 38
- 39
- 40
- 41
- 42
- 43
- 44
- 45
- 46
- 47
- 48
- 49
- 50
- 51
- 52
- 53
- 54
- 55
- 56
- 57
- 58
- 59
- 60
- 61
- 62
- 63
- 64
- 65
- 66
- 67
- 68
- 69
- 70
- 71
- 72
- 73
- 74
- 75
- 76
- 77
- 78
- 79
- 80
- 81
- 82
- 83
- 84
- 85
- 86
- 87
- 88
- 89
- 90
- 91
- 92
- 93
- 94
- 95
- 96
- 97
- 98
- 99
- 100
- 101
- 102
- 103
- 104
- 105
- 106
- 107
- 108
- 109
- 110
- 111
- 112
- 113
- 114
- 115
- 116
- 117
- 118
- 119
- 120
- 121
- 122
- 123
- 124
- 125
- 126
- 127
- 128
- 129
- 130
- 131
- 132
- 133
- 134
- 135
- 136
- 137
- 138
- 139
- 140
- 141
- 142
- 143
- 144
- 145
- 146
- 147
- 148
- 149
- 150
- 151
- 152
- 153
- 154
- 155
- 156
- 157
- 158
- 159
- 160
- 161
- 162
- 163
- 164
- 165
- 166
- 167
- 168
- 169
输出的效果可见: