
热门标签
热门文章
- 1PHP上传图片
- 2WPF——Prism框架,数据绑定_wpf prism框架好用吗
- 3Oracle的这些BUG你要遇到,说明你是一个DBA老鸟...
- 4怎么学习汇川Codesys PLC教程?
- 5【单端S参数与差分S参数转化】_sdc11
- 6uni-app 微信小程序之好看的ui登录页面(三)_小程序登录页
- 7python爬虫的9个实例_python爬虫实例
- 8ArangoDB笔记1---安装,启动,授权,名词说明,简单增删改查_arangodb windows
- 92023年第十六届山东省职业院校技能大赛高职组“信息安全管理与评估”赛项规程_2023年山东省信息安全管理
- 10HTTP协议:签名和证书(一个故事)
当前位置: article > 正文
Hive+Hadoop数据分析模拟案例练习_hive 数据分层练习案列
作者:知新_RL | 2024-06-17 17:06:05
赞
踩
hive 数据分层练习案列
需求分析
对电影评分数据进行统计分析,最后以可视化的形式展示出来
数据获取与上传
数据地址https://files.grouplens.org/datasets/movielens/
选择100w条评分的数据
![]()
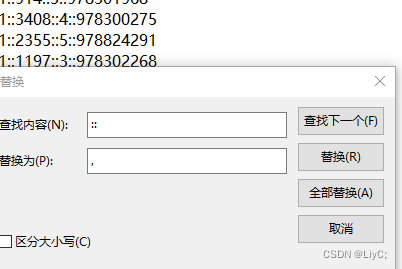
解压后选择movies、ratings两个文件即可,在上传前需要用记事本打开这两个文件,将分隔符替换为逗号。将文件上传到Linux本地中。

在hive中创建两个表
- create table movies(
- movie_id int comment "电影ID",
- movie_name string comment "电影名称",
- movie_type string comment "电影类别")
- row format delimited fields terminated by ',';
- create table ratings(
- user_id int comment "用户ID",
- movie_id string comment "电影ID",
- movie_rank int comment "电影评分",
- rank_timestamp int comment "评分时间戳"
- )row format delimited fields terminated bys ',';
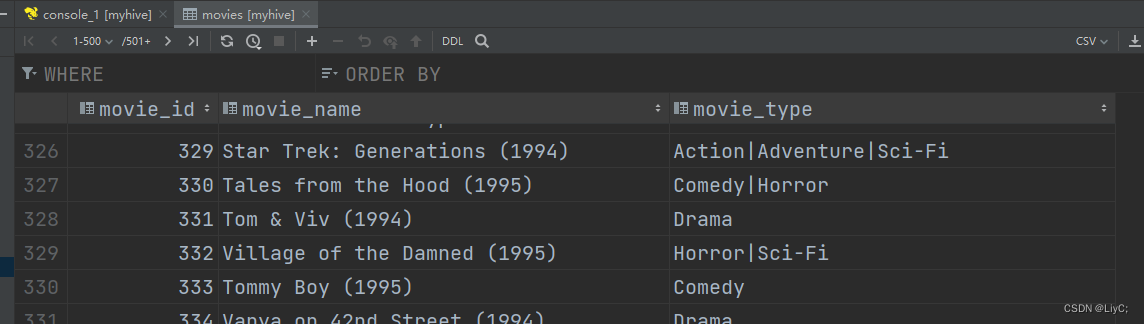
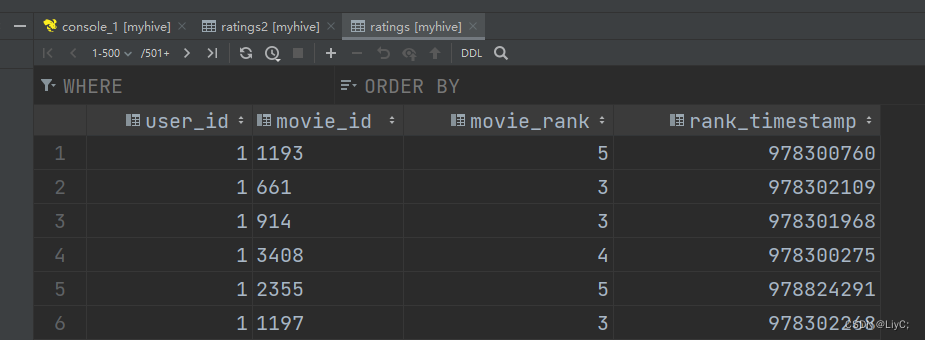
给表加载数据
load data local inpath '/data/root/env/movies.dat' into table movies;load data local inpath '/data/root/env/ratings.dat' into table ratings;查看结果
数据转换(ETL)
进行简单的ETL,将数据取出后进行简单的转换然后存入新的表中
将ratings表中的时间戳转换成年月日。因为hive不支持直接对表进行update和delete操作,所以需要创建新的表来完成。
创建ratings2表
- create table ratings2(
- user_id int comment "用户ID",
- movie_id string comment "电影ID",
- movie_rank int comment "电影评分",
- rank_day string comment "评分日期",
- rank_hour string comment "评分时间"
- )row format delimited fields terminated by ',';
对ratings表计算,使用from_unixtime()函数将时间戳转换成日期,用data函数取日期的年月日,用hour函数取日期的小时,并将结果插入到2表
- insert overwrite table myhive.ratings2
- select
- user_id,
- movie_id,
- movie_rank,
- DATE(from_unixtime(rank_timestamp)) as rank_day,
- hour(from_unixtime(rank_timestamp)) as rank_hour
- from ratings;
转换结果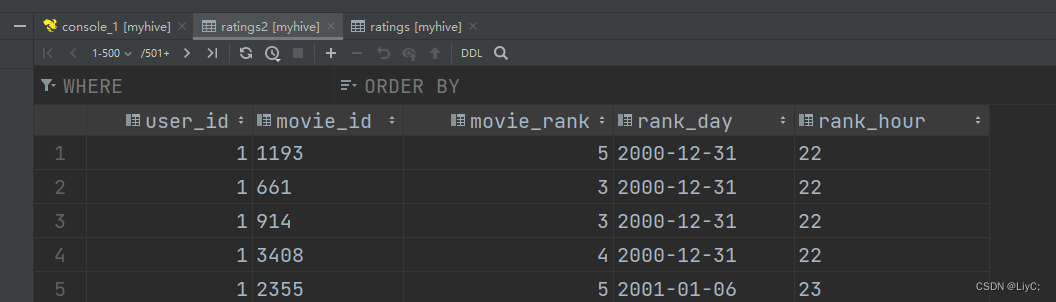
统计
要求:
- 统计每日评分总量
- 统计每小时评分的数量和用户量
- 统计各用户评分次数总量
- 统计评分次数TOP10的用户
- 统计各电影被评分次数和平均分
- 统计平均分TOP10的电影
- 统计观影次数TOP10的电影
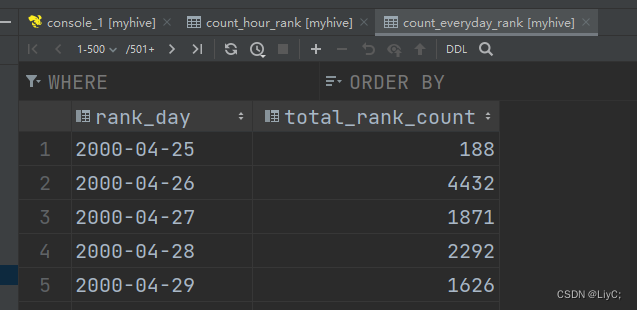
统计每日评分总量
创建查询语句,创建count_everyday_rank表,它的内容为查询到的结果
- create table count_everyday_rank
- comment "每日评分总量" as
- select
- rank_day,
- count(*) as total_rank_count
- from ratings2 group by rank_day;
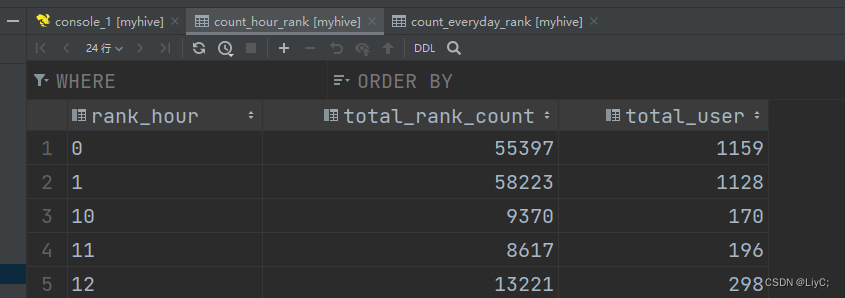
统计每小时评分的数量和用户量
- create table count_hour_rank
- comment "每小时评分量" as
- select
- rank_hour,
- count(*) as total_rank_count,
- count(distinct user_id) as total_user
- from ratings2 group by rank_hour;
统计各用户评分次数总量
- create table count_everyone_rank
- comment "每人的总评分次数" as
- select
- user_id,
- count(*) as all_count
- from ratings2 group by user_id;
统计评分次数TOP10的用户
- create table count_everyone_rank_top10
- comment "评分次数top10用户" as
- select
- user_id,
- count(*) as all_count
- from ratings2 group by user_id
- order by all_count desc
- limit 10;
统计各电影被评分次数和平均分
- create table movie_info
- comment "电影评分次数和平均分" as
- select
- movie_id,
- count(*) as all_count,
- avg(movie_rank) as avg_rank
- from ratings2 group by movie_id;
统计平均分TOP10的电影
对于只有一个评价的电影且它的评分就是5,那么计算得到的平均分也是5,这样的数据是没有说服力的,所以需要至少拥有500个评分的电影来计算平均值。
- create table movie_avg_rank_top10
- comment "movie_avg_rank_top10" as
- select a.movie_id,m.movie_name,a.all_count,a.avg_rank
- from (
- select
- r.movie_id,
- count(*) as all_count,
- avg(movie_rank) as avg_rank
- from ratings2 r
- group by movie_id
- having all_count > 500
- order by avg_rank desc limit 10
- ) as a
- join movies m
- on a.movie_id=m.movie_id;
统计观影次数TOP10的电影
- create table movie_count_top10
- comment "movie_count_top10" as
- select a.movie_id,m.movie_name,a.all_count
- from (
- select
- r.movie_id,
- count(*) as all_count
- from ratings2 r
- group by r.movie_id
- order by all_count desc limit 10
- ) as a
- join movies m
- on m.movie_id=a.movie_id;
数据展示
使用FineBI连接hive数据库并展示数据

声明:本文内容由网友自发贡献,不代表【wpsshop博客】立场,版权归原作者所有,本站不承担相应法律责任。如您发现有侵权的内容,请联系我们。转载请注明出处:https://www.wpsshop.cn/w/知新_RL/article/detail/732064
推荐阅读
相关标签

