
热门标签
热门文章
- 1鸿蒙操作是基于安卓,华为鸿蒙系统终于发布,与安卓有何区别?随时可以应用在手机上...
- 2网络安全——数据链路层安全协议_数据链路层协议
- 3Fiddler抓包(下载安装及使用)_fiddler抓包下载
- 4C语言人工智能AI聊天模型:原理、实现与应用_数据模型编程c语言代码ai技术计算机
- 5时序预测中Attention机制是否真的有效?盘点LSTM/RNN中24种Attention机制+效果对比_lstmattention
- 6纯娱乐,教你用AI花10分钟为自己定做理想女友_云服务器下载chilloutmix_niprunedfp32fi
- 7并行编译技术_计算机体系结构——探索指令级并行的基本编译器技术
- 8Temporal Convolutional Networks and Forecasting(TCN进行时序预测使用Darts库,中文版+链接)_tcn感受野计算
- 9生成古风少女图片【InsCode Stable Diffusion美图活动一期】_sd模型生成的古风图片
- 10win10利用cmd或者powershell快速打开软件。_win10用windows powershell打开软件
当前位置: article > 正文
Leaflet聚合图层---Leaflet.markercluster_markercluster 所有属性
作者:盐析白兔 | 2024-03-14 13:43:09
赞
踩
markercluster 所有属性
作者:刘大
Leaflet.markercluster是Leaflet中运用比较多的一个可视化插件,本文我们就细说下该插件下的属性和方法。
####1.属性
在markercluster的gitbub地址https://github.com/Leaflet/Leaflet.markercluster上,已经详细介绍了各个属性的用法和作用。下面也通过一张表简单总结下
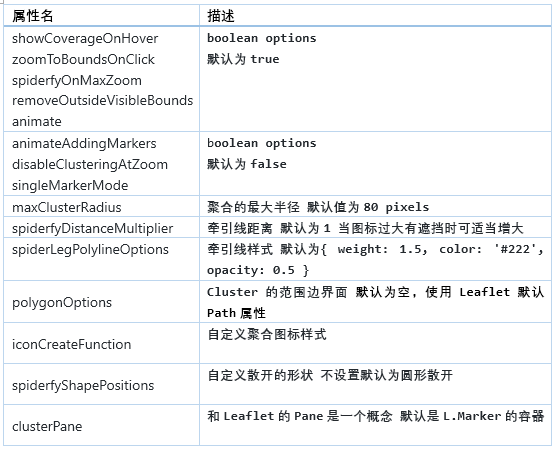
下面重点说下spiderfyShapePositions和iconCreateFunction
#####1.1 spiderfyShapePositions
在markercluster 1.4.1的版本中使用spiderfyShapePositions该属性无效,可查看https://github.com/Leaflet/Leaflet.markercluster/issues/994
主要是因为1.4.1版本中未加入改自定义的方法。我们可在使用前重新加入,代码如下
  L.MarkerCluster.include({ spiderfy: function () {
	if (this._group._spiderfied === this || this._group._inZoomAnimation) {
		return;
	}

	var childMarkers = this.getAllChildMarkers(null, true),
		group = this._group,
		map = group._map,
		center = map.latLngToLayerPoint(this._latlng),
		positions;

	this._group._unspiderfy();
	this._group._spiderfied = this;

	//TODO Maybe: childMarkers order by distance to center

	if (this._group.options.spiderfyShapePositions) {
		positions = this._group.options.spiderfyShapePositions(childMarkers.length, center);
	} else if (childMarkers.length >= this._circleSpiralSwitchover) {
		positions = this._generatePointsSpiral(childMarkers.length, center);
	} else {
		center.y += 10; // Otherwise circles look wrong => hack for standard blue icon, renders differently for other icons.
		positions = this._generatePointsCircle(childMarkers.length, center);
	}

	this._animationSpiderfy(childMarkers, positions);
}});
    resultLayer = L.markerClusterGroup({
        spiderfyOnMaxZoom: false,
        showCoverageOnHover: false,
        zoomToBoundsOnClick: false,
        spiderfyShapePositions: function(count, centerPt) {
                var distanceFromCenter = 35,
                    markerDistance = 45,
                    lineLength = markerDistance * (count - 1),
                    lineStart = centerPt.y - lineLength / 2,
                    res = [],
                    i;

                res.length = count;

                for (i = count - 1; i >= 0; i--) {
                    res[i] = new L.Point(centerPt.x + distanceFromCenter, lineStart + markerDistance * i);
                }

                return res;
            }
    });

- 1
- 2
- 3
- 4
- 5
- 6
- 7
- 8
- 9
- 10
- 11
- 12
- 13
- 14
- 15
- 16
- 17
- 18
- 19
- 20
- 21
- 22
- 23
- 24
- 25
- 26
- 27
- 28
- 29
- 30
- 31
- 32
- 33
- 34
- 35
- 36
- 37
- 38
- 39
- 40
- 41
- 42
- 43
- 44
- 45
- 46
- 47
- 48
使用前后对比:
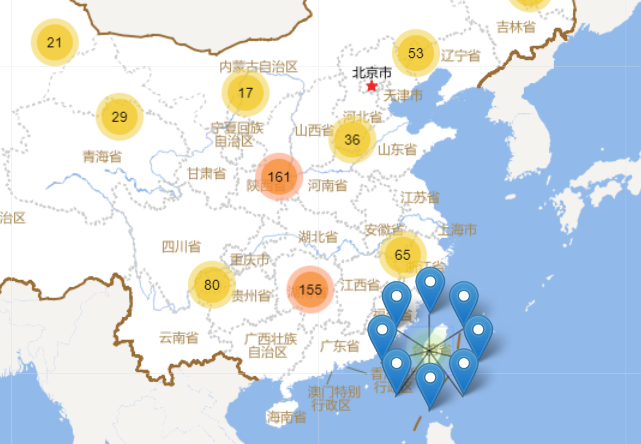
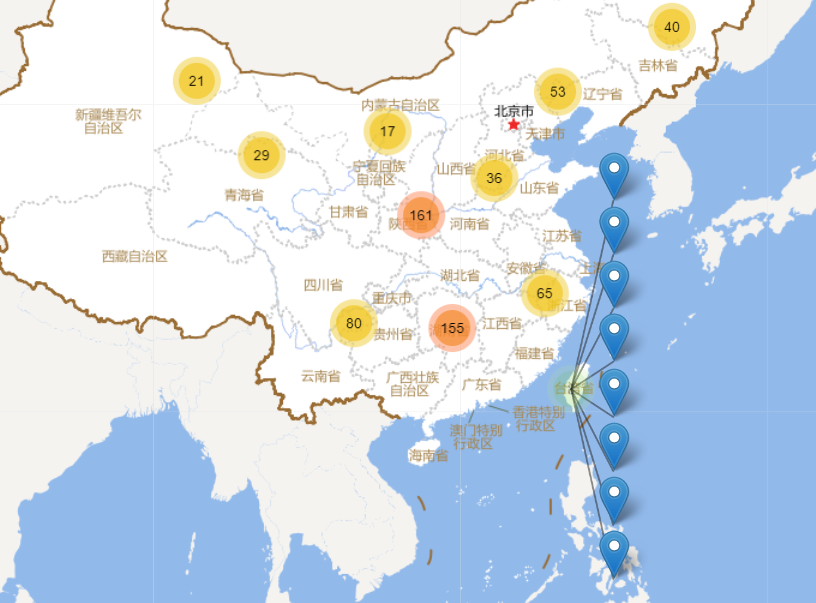
由此我们就可以根据自己的业务需求制定散开的形状了
如果你不想自定义,可以使用该插件下的子插件Leaflet.MarkerCluster.PlacementStrategies
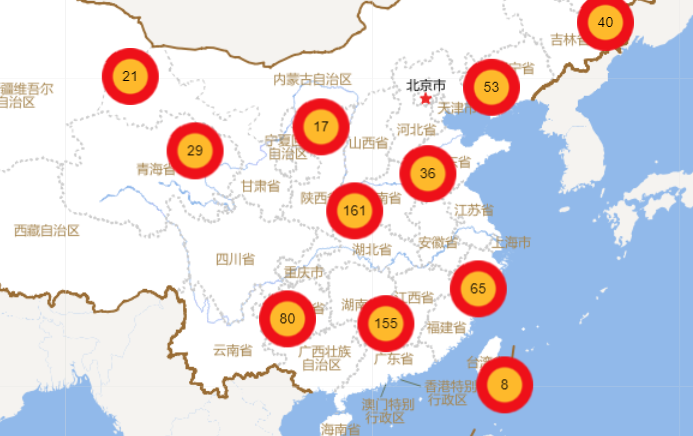
#####1.2 iconCreateFunction
 resultLayer = L.markerClusterGroup({
        spiderfyOnMaxZoom: false,
        showCoverageOnHover: false,
        zoomToBoundsOnClick: false,
        iconCreateFunction: function(cluster) {
		return L.divIcon({ className:'customstyle',html: '<div class="customstyle">' + cluster.getChildCount() + '</div>' });
	}
- 1
- 2
- 3
- 4
- 5
- 6
- 7
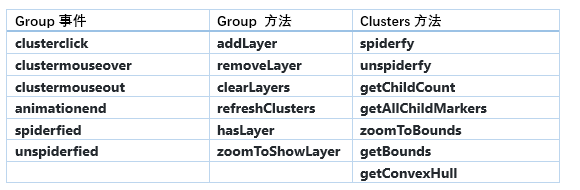
####2.事件&方法
事件可L.Marker事件一样,只是需在前面添加‘cluster’
方法可概括为
点击判断个数并进行散开或缩放
    resultLayer.on('clusterclick',function(a){
        if(a.layer.getChildCount()<20){
           a.layer.spiderfy()
        } else {
            a.layer.zoomToBounds()
        }
    })
- 1
- 2
- 3
- 4
- 5
- 6
- 7
其他事件和方法可以根据具体需求进行调用。
声明:本文内容由网友自发贡献,不代表【wpsshop博客】立场,版权归原作者所有,本站不承担相应法律责任。如您发现有侵权的内容,请联系我们。转载请注明出处:https://www.wpsshop.cn/w/盐析白兔/article/detail/234898
推荐阅读
相关标签

