
热门标签
热门文章
- 1深度学习落地实战:大模型生成图片
- 2MacOS 13 Ventura实现对 NTFS 格式文件的读写功能_macos ventura ntfs
- 3CentOS7安装Docker(超详细)
- 4如何测试AI对话模型/智能体?看这篇就够了_测试ai聊天哪些内容
- 5【Go系列】RPC和grpc
- 6【人工智能】Transformers之Pipeline(五):深度估计(depth-estimation)
- 7groupby函数_干货分享|达梦数据库常用集函数与分析函数_达梦 group by用法
- 8Java面试指南_光锥元机试
- 9在IDEA中使用Git在将多次commit合并为一次commit_idea 多次 commit 和并为一个 commit 提交
- 10自主 AI Agent 的构建|Function Calling 技术实例探索_agent function call
当前位置: article > 正文
Servlet+Echart在前端图表展示数据库数据_servlet + jdbc + echarts实现数据库数据展示
作者:小桥流水78 | 2024-07-15 08:37:07
赞
踩
servlet + jdbc + echarts实现数据库数据展示
#【小案例系列】
1.如何用Servlet+Echart在前端展示数据库数据?
1.下载框架文件:
链接:https://pan.baidu.com/s/18Yg4l_PGyxpUXsaE0M3H_g
提取码:f1iv

2.下载导入后,在helloBar层的*dao,*Bean中按照自己的库表设计进行修改,可以Java application运行判断是否取出数据;
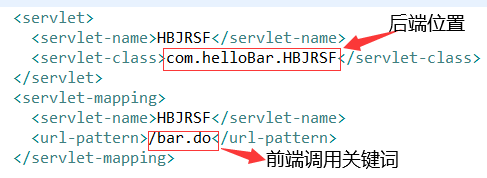
3.取出成功后,在xml处建立前后端的映射关系:
如图:
4.在jsp页面或者js文件中获取后端json数据并画图,例如:
4.1 新建一个div放置图表;
 4.2 引入图表的js文件;

4.3 js文件代码;
// 路径配置
	require.config({paths : {echarts : 'http://echarts.baidu.com/build/dist'}});
	// 使用
	require([ 'echarts', 'echarts/chart/line'], drewEcharts_line); // 使用折线图就加载line模块,按需加载
	var linename = ['累计确诊','新增确诊'];
	var date = new Date();
	var value = date .toLocaleDateString();
function drewEcharts_line(ec){
    	var TM = [] ;
    	var CFD_SX= [];
    	var CFD_NEW= [];
    	//console.log("ddd");
		// 基于准备好的dom,初始化echarts图表
		var myChart = ec.init(document.getElementById('sxyq_fzqs'));
		/* function e(){ */
            $.ajax({
            type : "post",
            async : false, //同步执行
            url : "barRainfall.do",
            data : {},
            dataType : "json", //返回数据形式为json
            success : function(result){
            if (result){
           	 for(var i=0;i<result.length;i++){
               TM.push(result[i].TM);
               CFD_SX.push(result[i].CFD_SX);
               CFD_NEW.push(result[i].CFD_NEW);
            	}
            }},})
               /*error: function(errorMsg){
                  alert("图表请求数据失败!");
                  myChart.hideLoading();
               }*/
		var option = {
			tooltip : {show : true},
			 title: {
				 x: 'center',
				 y: 'top',
				 text: '陕西新冠肺炎发展趋势',
				 textStyle: { color: '#000'},
				 subtext: '数据更新时间:'+value+' 上午9:30:00',
				 subtextStyle: {color: '#000'}
			 },
			legend : {
				data : linename,
				x: 'center',
				y: 'bottom'},
			xAxis : [{
				type : 'category',
				data : TM,
				}],
			yAxis : [ {type : 'value'}],
			series : [{
				"name" : "累计确诊",
				"type" : "line",
				"data" : CFD_SX,
				itemStyle : { normal: {label : {show: true}}}
					},
					{
				"name" : "新增确诊",
				"type" : "line",
				"data" : CFD_NEW,
				itemStyle : { normal: {label : {show: true}}}
					}
			]};
		// 为echarts对象加载数据
		myChart.setOption(option);}

- 1
- 2
- 3
- 4
- 5
- 6
- 7
- 8
- 9
- 10
- 11
- 12
- 13
- 14
- 15
- 16
- 17
- 18
- 19
- 20
- 21
- 22
- 23
- 24
- 25
- 26
- 27
- 28
- 29
- 30
- 31
- 32
- 33
- 34
- 35
- 36
- 37
- 38
- 39
- 40
- 41
- 42
- 43
- 44
- 45
- 46
- 47
- 48
- 49
- 50
- 51
- 52
- 53
- 54
- 55
- 56
- 57
- 58
- 59
- 60
- 61
- 62
- 63
- 64
- 65
- 66
- 67
4.4 注意事项:

声明:本文内容由网友自发贡献,不代表【wpsshop博客】立场,版权归原作者所有,本站不承担相应法律责任。如您发现有侵权的内容,请联系我们。转载请注明出处:https://www.wpsshop.cn/w/小桥流水78/article/detail/828489
推荐阅读
相关标签

