
热门标签
热门文章
- 1vscode 文件无法修改一直亮光标解决办法_vscode光标移动但无法编辑
- 2无法解析的外部符号 "class google::protobuf::internal::ExplicitlyConstructed fixed_address_empty_string
- 3如何正确使用迁移学习_迁移学习 尺寸
- 4unable to connect to 192.168.1.110:5555 解决办法(不用RootAndroid设备)_already connected to 192.168.1.110:5555
- 5Java反序列化漏洞利用及修复 示例代码_java 反序列化漏洞利用
- 6Android Studio 模块打aar 引入aar详细步骤_androidstudio引入aar包
- 7算法数据结构——玩转递归算法(Recursion)使用套路及具体应用实例讲解_数据结构递归模型
- 8Charles修改参数_charlos修改参数,可以无视入参吗
- 9AI Agent: AI的下一个风口 具身智能的定义与特点_具身智能agent
- 10Xcode检测不到iPhone设备_xcode无法识别ios17系统以上的手机
当前位置: article > 正文
用Vue搭建一个大屏数据可视化页面实战二(Vue实战系列)_vue大屏可视化模板
作者:小惠珠哦 | 2024-07-30 13:27:02
赞
踩
vue大屏可视化模板
接上文 用Vue搭建一个大屏数据可视化页面实战一
把之前写的代码抽离成组件
把之前写的一个个的panel抽离成组件,方便后期复用,形状功能类似的我们考虑把他们统一封装成组件
以whr-panel-c1为例
<!--whr-panel-c1  2021/4/15 @王浩然QQ378237242-->
<template>
  <div class="panel-hezi" ref="panelhezi">
    <div class="panel-hezi-background"></div>
    <!--    <svg class="svg-head"  preserveAspectRatio="xMaxYMax" viewBox="0,0,100,100" v-if="type=='triangle'">-->
    <svg class="svg-triangle-head" preserveAspectRatio="xMaxYMax" :viewBox="`0,0,${tipSize.width},${tipSize.height}`"
         v-if="type=='triangle'">
      <defs>
        <linearGradient :id="randomId" x1="0%" y1="0%" x2="0%" y2="100%">
          <stop offset="0%" :style="{stopColor:tipColor[0],stopOpacity:1}"/>
          <stop offset="100%" :style="{stopColor:tipColor[1],stopOpacity:1}"/>
        </linearGradient>
      </defs>
      <!--      <path d="M 0 0 l 90 0 l -90 90" :fill="`url(#${randomId})`"></path>-->
      <path :d="dpath" :fill="`url(#${randomId})`"></path>
    </svg>
    <div class="rectangle-head" v-if="type=='rectangle'">
      <div class="rectangle-head-box">
        <div>
          <img class="hezi-rectangle-icon" :src="tipIcon">
        </div>

        <div style="display: table">
          <div class="title" style="display: table-cell;vertical-align: middle">{{ title }}</div>
        </div>
      </div>
    </div>
    <img class="hezi-triangle-icon" :src="tipIcon" v-if="type=='triangle'">

    <div class="panel-hezi-triangle-title" v-if="type=='triangle'">
      <div class="title flex">
        <div class="triangle-title">{{ title }}</div>
        <div style="width: 100%;overflow: hidden">
          <svg preserveAspectRatio="xMaxYMax" :viewBox="`0,0,${panelSize.width - tipSize.width - 20},50`">
            <polyline points="0,15 50,15 60,10,65,18 70,15 90,15 95,5 100,25 105,15 120,15 130,15 140,5 150,20 160,15 190,15,200,8 210,20 220,15 230,15 250,15"
                      style="fill:none;stroke:white;stroke-width:1.5" />
            <!--          <path :d="dpath" :fill="`url(#${randomId})`"></path>-->
          </svg>
        </div>

      </div>
    </div>
    <div class="panel-hezi-triangle-body" v-if="type=='triangle'">
      <slot name="tbody"></slot>
    </div>
    <div class="panel-hezi-rectangle-body" v-if="type=='rectangle'">
      <slot name="tbody"></slot>
    </div>
  </div>
</template>

- 1
- 2
- 3
- 4
- 5
- 6
- 7
- 8
- 9
- 10
- 11
- 12
- 13
- 14
- 15
- 16
- 17
- 18
- 19
- 20
- 21
- 22
- 23
- 24
- 25
- 26
- 27
- 28
- 29
- 30
- 31
- 32
- 33
- 34
- 35
- 36
- 37
- 38
- 39
- 40
- 41
- 42
- 43
- 44
- 45
- 46
- 47
- 48
- 49
- 50
调用whr-panel-c1组件
	<whr-panel-c1 :tip-icon-size="{width:90,height:90}" :tip-size="{width:200,height:150}"
                    :tip-color="['#f61792','#c0d7e3']" :tip-icon="require('@/views/网络.svg')">
        <template v-slot:tbody>
          123
        </template>
      </whr-panel-c1>
      <whr-panel-c1 :panel-size="{width:200,height:200}" :tip-color="['#2a529d','#990ef1']"
                    :tip-icon="require('@/views/环动.svg')"></whr-panel-c1>
      <whr-panel-c1 type="triangle" :tip-size="{width:200,height:150}" :tip-color="['#f61792','#c0d7e3']"
                    :tip-icon="require('@/views/网络.svg')">
        <template v-slot:tbody>
          123
        </template>
      </whr-panel-c1>
      <whr-panel-c1 type="triangle" :tip-color="['#2a529d','#990ef1']"
                    :tip-icon="require('@/views/环动.svg')"></whr-panel-c1>
- 1
- 2
- 3
- 4
- 5
- 6
- 7
- 8
- 9
- 10
- 11
- 12
- 13
- 14
- 15
- 16
所涉及到的参数:
props: {
    //种类呗:triangle三角形rectangle矩形
    type: {
      required: true,
      type: String,
      default: "rectangle"
    },
    title: {
      type: String,
      default: "标题"
    },
    //背景色一个数组,传入俩颜色渐变
    backgroundColor: {
      type: Array,
      default: function () {
        return ["#1d6bfc", "#1eb1fd"]
      }
    },
    panelSize: {
      required: true,
      default: function () {
        return {
          width: 400,
          height: 300
        }
      }
    },
    //tip尺寸
    tipSize: {
      type: Object,
      default: function () {
        return {
          width: 100,
          height: 100
        }
      }
    },
    //tip
    tipIconSize: {
      type: Object,
      default: function () {
        return {
          width: 32,
          height: 32
        }
      }
    },
    //图标区域颜色,渐变色
    tipColor: {
      type: Array,
      default: function () {
        return ["#51acf6", "#59d6e3"]
      }
    },
    //图标
    tipIcon: {
      type: String,
      default: ""
    }
  },
- 1
- 2
- 3
- 4
- 5
- 6
- 7
- 8
- 9
- 10
- 11
- 12
- 13
- 14
- 15
- 16
- 17
- 18
- 19
- 20
- 21
- 22
- 23
- 24
- 25
- 26
- 27
- 28
- 29
- 30
- 31
- 32
- 33
- 34
- 35
- 36
- 37
- 38
- 39
- 40
- 41
- 42
- 43
- 44
- 45
- 46
- 47
- 48
- 49
- 50
- 51
- 52
- 53
- 54
- 55
- 56
- 57
- 58
- 59
- 60
这样我们所涉及到的参数基本都可以调整。
重写组织页面页面排版
这里遇到一个问题
谷歌浏览器里的样式
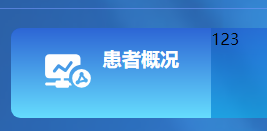
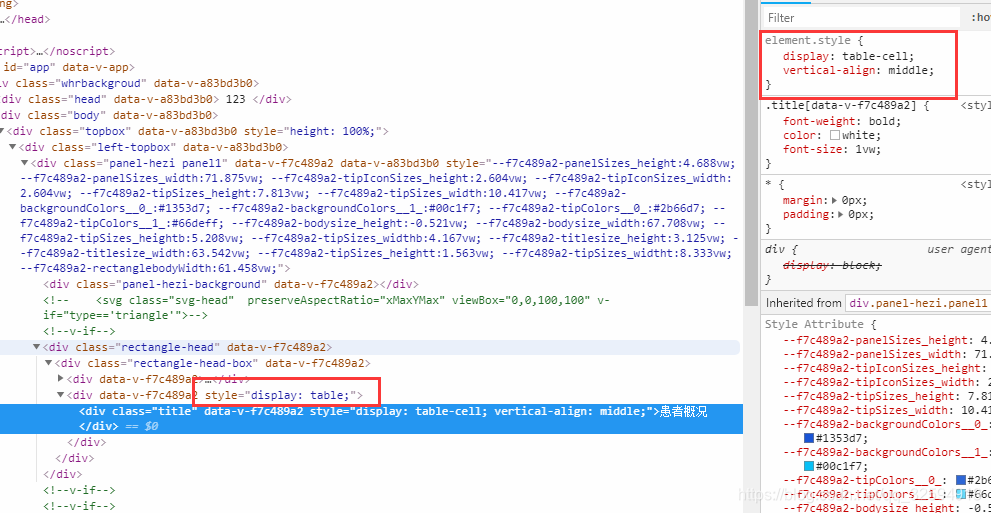
火狐浏览器里面没有问题。
这是什么原因,有小伙伴知道吗?
在Vue中搭建一个大屏数据可视化页面,通常涉及到组件的开发与整合。这里,我们将通过实战二来演示如何开发Vue组件,并整合到大屏页面中。
实战二:组件开发
步骤一:创建Vue组件
首先,在Vue项目中创建一个新的组件,比如DataVisualization.vue。这个组件将用于封装大屏数据可视化的逻辑和样式。
<template>
  <div class="data-visualization">
    <!-- 在这里添加数据可视化的图表元素 -->
  </div>
</template>

<script>
export default {
  name: 'DataVisualization',
  props: {
    // 定义传入的属性,比如数据、配置等
  },
  data() {
    return {
      // 组件内部数据
    };
  },
  mounted() {
    // 组件加载完成后执行的逻辑,比如初始化图表等
  },
  methods: {
    // 定义组件的方法
  }
};
</script>

<style scoped>
.data-visualization {
  /* 在这里添加组件的样式 */
}
</style>
- 1
- 2
- 3
- 4
- 5
- 6
- 7
- 8
- 9
- 10
- 11
- 12
- 13
- 14
- 15
- 16
- 17
- 18
- 19
- 20
- 21
- 22
- 23
- 24
- 25
- 26
- 27
- 28
- 29
- 30
- 31
步骤二:添加图表库
大屏数据可视化通常需要使用图表库来展示数据。你可以选择使用ECharts、Chart.js、D3.js等流行的图表库。
以ECharts为例,你可以通过npm安装ECharts:
npm install echarts --save
- 1
然后在组件中引入ECharts,并创建一个图表实例:
<template>
  <div class="data-visualization" ref="chartContainer"></div>
</template>

<script>
import * as echarts from 'echarts';

export default {
  // ...
  mounted() {
    this.initChart();
  },
  methods: {
    initChart() {
      // 基于准备好的dom,初始化echarts实例
      const myChart = echarts.init(this.$refs.chartContainer);
      // 绘制图表
      myChart.setOption({
        // 在这里配置图表选项
      });
    }
  }
};
</script>
- 1
- 2
- 3
- 4
- 5
- 6
- 7
- 8
- 9
- 10
- 11
- 12
- 13
- 14
- 15
- 16
- 17
- 18
- 19
- 20
- 21
- 22
- 23
- 24
步骤三:封装组件属性和方法
为了让组件更加通用和可复用,你可以封装组件的属性和方法。
比如,你可以定义一个chartData属性来接收父组件传入的数据,然后在组件内部使用这些数据来渲染图表:
<script>
export default {
  // ...
  props: {
    chartData: {
      type: Object,
      required: true
    }
  },
  methods: {
    initChart() {
      const myChart = echarts.init(this.$refs.chartContainer);
      myChart.setOption(this.getChartOption(this.chartData));
    },
    getChartOption(data) {
      // 根据传入的数据生成ECharts的配置选项
      return {
        // ...
      };
    }
  }
};
</script>
- 1
- 2
- 3
- 4
- 5
- 6
- 7
- 8
- 9
- 10
- 11
- 12
- 13
- 14
- 15
- 16
- 17
- 18
- 19
- 20
- 21
- 22
- 23
步骤四:在父组件中使用
最后,在父组件中使用DataVisualization组件,并传入相应的数据:
<template>
  <div class="dashboard">
    <DataVisualization :chartData="myChartData" />
  </div>
</template>

<script>
import DataVisualization from './DataVisualization.vue';

export default {
  components: {
    DataVisualization
  },
  data() {
    return {
      myChartData: {
        // 在这里准备图表所需的数据
      }
    };
  }
};
</script>
- 1
- 2
- 3
- 4
- 5
- 6
- 7
- 8
- 9
- 10
- 11
- 12
- 13
- 14
- 15
- 16
- 17
- 18
- 19
- 20
- 21
- 22
确保你的父组件中有myChartData这个数据属性,并且它的结构是DataVisualization组件所期望的。
通过以上的步骤,你就可以开发出Vue中的大屏数据可视化组件,并将其整合到大屏页面中。根据实际需要,你还可以添加更多的交互逻辑、样式和组件来提升用户体验和数据展示效果。
声明:本文内容由网友自发贡献,不代表【wpsshop博客】立场,版权归原作者所有,本站不承担相应法律责任。如您发现有侵权的内容,请联系我们。转载请注明出处:https://www.wpsshop.cn/w/小惠珠哦/article/detail/903910
推荐阅读
相关标签

