
热门标签
热门文章
- 1十四、事务——Undo日志_undo日志中的rollpoint指向哪里
- 2Hive之数据类型
- 3区块链——公有链,私有链,联盟链_区块链 公链 私链
- 4Spring不止AOP与IOC:Spring生态详解
- 5杭电和苏大计算机考研,江苏省各高校“排行榜”出炉,江苏大学10名开外,南大当属第一!...
- 6PostgresSQL存储过程和触发器_postgrel的存储过程和触发器怎么写
- 7Fucking on [non-breakable space] and [trailing space]
- 8git上传gitee(超过100MB的文件问题)_gitee lfs
- 92022信息安全保研_华科网安保研
- 10Java课程设计【学生信息管理系统】_学生信息管理系统java课程设计
当前位置: article > 正文
基于canvas和ol的点标注的避让实现_ol地图标点
作者:小丑西瓜9 | 2024-06-16 20:25:42
赞
踩
ol地图标点
概述
在做地图的时候,点的标注展示是一个非常常见的功能,但是十几种点在某些区域比较密集是非常常见的,但是业务表达中却需要将之展示出来。基于此需求,本文结合canvas和ol做一简单的实现。
效果
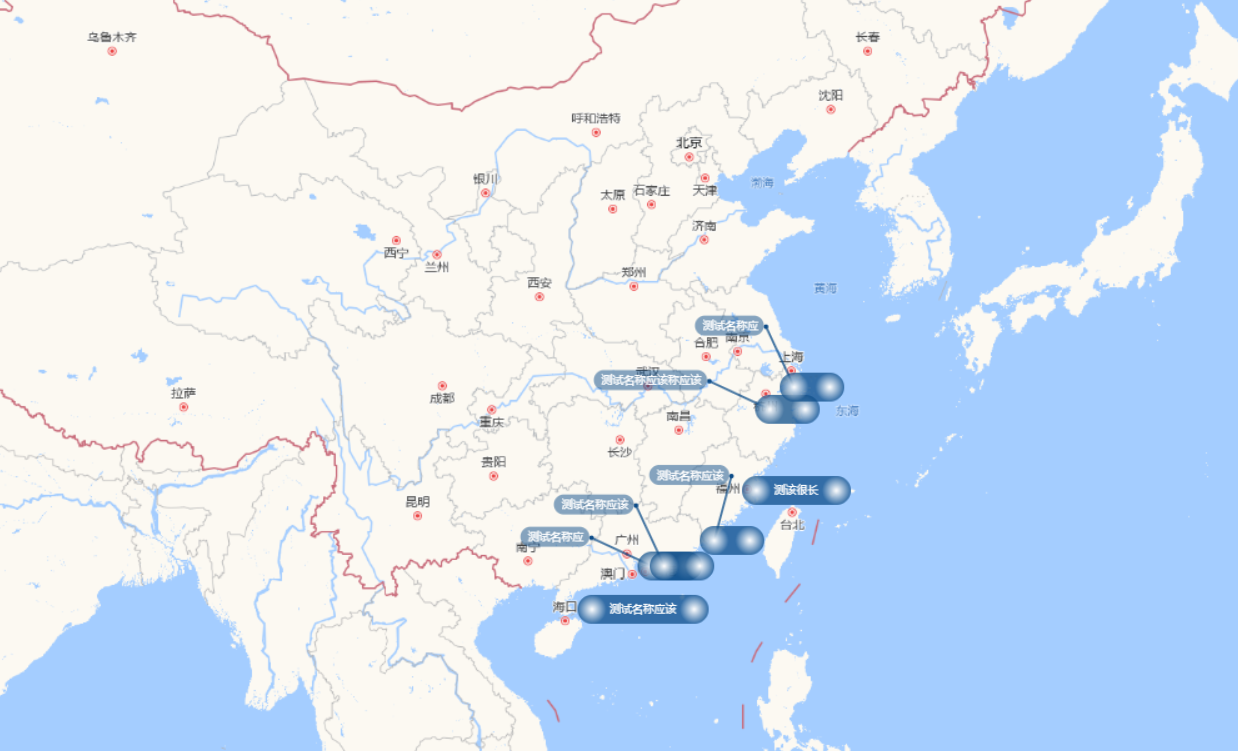
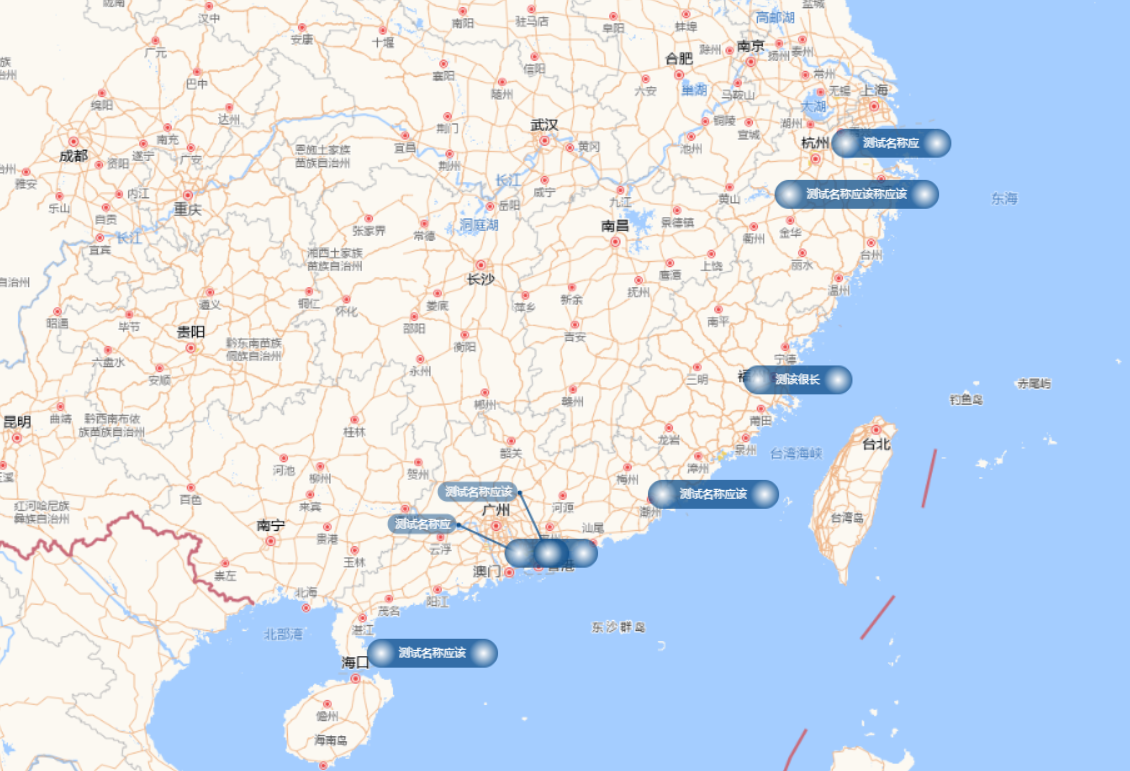
实现:
- 密集区点的标注通过牵引线的方式引出展示;
- 地图放大的时候更新展示;
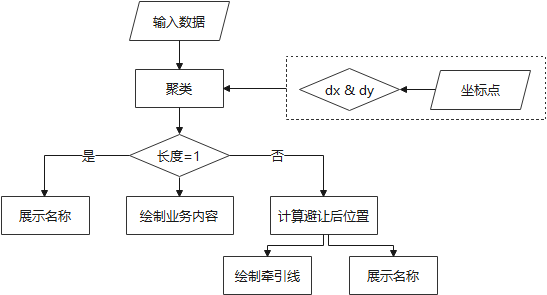
思路
实现代码
const points = [
  { "properties": {"name":"测试名称应该"}, "geometry": { "type": "Point", "coordinates": [ 110.15558, 19.91038 ] } },
  { "properties": {"name":"测试名称应"}, "geometry": { "type": "Point", "coordinates": [ 113.52309, 22.21177 ] } },
  { "properties": {"name":"测试名称应该"}, "geometry": { "type": "Point", "coordinates": [ 114.23454, 22.21177 ] } },
  { "properties": {"name":"测该很长"}, "geometry": { "type": "Point", "coordinates": [ 119.35695, 26.06293 ] } },
  { "properties": {"name":"测试名称应该称应该"}, "geometry": { "type": "Point", "coordinates": [ 120.11582, 30.07927 ] } },
  { "properties": {"name":"测试名称应"}, "geometry": { "type": "Point", "coordinates": [ 121.49129, 31.14058 ] } },
  { "properties": {"name":"测试名称应该"}, "geometry": { "type": "Point", "coordinates": [ 117.03289, 23.5228 ] } }
]
let canvasFunction = function (extent, resolution, pixelRatio, size, projection) {
  const canvasWidth = size[0]
  const canvasHeight = size[1]
  const [w, h] = map.getSize()
  const xoff = canvasWidth - w,
    yoff = canvasHeight - h
  const canvas = document.createElement('canvas');
  canvas.width = canvasWidth
  canvas.height = canvasHeight
  const context = canvas.getContext('2d');
  // 数据聚类处理,根据上下和左右的距离进行判断
  function clusterData(data) {
    let res = {}
    let clusterTest = function (pixel, tolrance = [200, 30]) {
      let r = pixel.join(',')
      const [x, y] = pixel
      for (let key in res) {
        const [_x, _y] = key.split(',').map(Number)
        const dx = Math.abs(x - _x),
          dy = Math.abs(y - _y)
        if(dx < tolrance[0] && dy < tolrance[1]) {
          r = key
          break
        }
      }
      return r
    }
    for (let i = 0; i < data.length; i++) {
      const d = data[i]
      const coords = ol.proj.fromLonLat(d.geometry.coordinates)
      let pixel = map.getPixelFromCoordinate(coords)
      pixel = [pixel[0]  + xoff / 2, pixel[1] + yoff / 2].map(p => Math.round(p))
      d.pixel = pixel
      let key = pixel.join(',')
      const width = 26 * 2 + 6 + context.measureText(d.properties.name).width
      key = clusterTest(pixel, [width, 30])
      if(!res[key]) res[key] = []
      res[key].push(d)
    }
    return res
  }
  // 绘制两边为圆的矩形
  function drawRoundRect (ctx, x, y, width, height = 24, fillStyle = 'rgba(14,77,137,0.75)') {
    const r = height / 2
    ctx.fillStyle = fillStyle
    ctx.beginPath()
    ctx.moveTo(x + r, y)
    ctx.lineTo(x + width - r, y)
    ctx.arc(x + width - r, y + r, r, Math.PI * 1.5, Math.PI * 0.5)
    ctx.lineTo(x + r, y + height)
    ctx.arc(x + r, y + height - r, r, Math.PI * 0.5, Math.PI * 1.5)
    ctx.closePath()
    ctx.fill()
  }
  // 绘制feature
  function drawFeature (ctx, x = 10, y = 10, text, notCluster = true, index = 0) {
    let height = 26, width = height * 2 + 6,  r = height / 2
    if(notCluster) width += ctx.measureText(text).width
    ctx.save()
    // 如果有聚类,则避让绘制文字,放在前面是为了让指引线在下面
    if(!notCluster && map.getView().getZoom() > 4) {
      const radius = 60
      const ang  = (-index * 40 - 115) / 180 * Math.PI ;
      const cx = x + r, cy = y + height - r
      const px = cx + Math.sin(ang) * radius,
        py = cy + Math.cos(ang) * radius
      // 绘制牵引线
      ctx.beginPath()
      ctx.strokeStyle = 'rgba(14,77,137,0.75)'
      ctx.lineWidth = 2
      ctx.moveTo(cx, cy)
      ctx.lineTo(px, py)
      ctx.stroke()
      // 绘制牵引线终点小圆圈
      ctx.beginPath()
      ctx.fillStyle = 'rgba(14,77,137,1)'
      ctx.arc(px, py, 2, 0, Math.PI * 2)
      ctx.fill()
      // 绘制矩形
      const h = 18
      const w = ctx.measureText(text).width + 12
      drawRoundRect(ctx, px - w - 2, py - h / 2 - 1, w, h, 'rgba(14,77,137,0.5)')
      // 绘制文字
      ctx.fillStyle = 'rgb(255,255,255)'
      ctx.beginPath()
      ctx.textAlign = 'right'
      ctx.textBaseline = 'middle'
      ctx.fillText(text, px - 7, py)
    }
    // 绘制矩形
    drawRoundRect(ctx, x, y, width, height)
    // 绘制左边的图标
    ctx.beginPath()
    const radialLeft = ctx.createRadialGradient(x + r, y + height - r, 0, x + r, y + height - r, r)
    radialLeft.addColorStop(0, '#fff')
    radialLeft.addColorStop(1, 'rgba(255,255,255,0)')
    ctx.fillStyle = radialLeft
    ctx.arc(x + r, y + height - r, r, 0, Math.PI * 2)
    ctx.fill()
    // 绘制右边的图标
    ctx.beginPath()
    const radialRight = ctx.createRadialGradient(x + width - r, y + r, 0, x + width - r, y + r, r)
    radialRight.addColorStop(0, '#fff')
    radialRight.addColorStop(1, 'rgba(255,255,255,0)')
    ctx.fillStyle = radialRight
    ctx.arc(x + width - r, y + r, r, 0, Math.PI * 2)
    ctx.fill()
    // 如果没有聚类,则绘制文字
    if(notCluster) {
      ctx.fillStyle = '#fff'
      ctx.beginPath()
      ctx.textAlign = 'left'
      ctx.textBaseline = 'middle'
      ctx.fillText(text, x + height + 3, y + height - r)
    }
    ctx.restore()
  }
  const cluster = clusterData(points)
  for (let key in cluster) {
    const data = cluster[key]
    const showText = data.length === 1
    data.forEach((d, index) => {
      const [x, y] = d.pixel
      drawFeature(context, x, y, d.properties.name, showText, index)
    })
  }
  return canvas;
}
const layer = new ol.layer.Image({
  source: new ol.source.ImageCanvas({
    canvasFunction: canvasFunction
  })
});
map.addLayer(layer);
script>

- 1
- 2
- 3
- 4
- 5
- 6
- 7
- 8
- 9
- 10
- 11
- 12
- 13
- 14
- 15
- 16
- 17
- 18
- 19
- 20
- 21
- 22
- 23
- 24
- 25
- 26
- 27
- 28
- 29
- 30
- 31
- 32
- 33
- 34
- 35
- 36
- 37
- 38
- 39
- 40
- 41
- 42
- 43
- 44
- 45
- 46
- 47
- 48
- 49
- 50
- 51
- 52
- 53
- 54
- 55
- 56
- 57
- 58
- 59
- 60
- 61
- 62
- 63
- 64
- 65
- 66
- 67
- 68
- 69
- 70
- 71
- 72
- 73
- 74
- 75
- 76
- 77
- 78
- 79
- 80
- 81
- 82
- 83
- 84
- 85
- 86
- 87
- 88
- 89
- 90
- 91
- 92
- 93
- 94
- 95
- 96
- 97
- 98
- 99
- 100
- 101
- 102
- 103
- 104
- 105
- 106
- 107
- 108
- 109
- 110
- 111
- 112
- 113
- 114
- 115
- 116
- 117
- 118
- 119
- 120
- 121
- 122
- 123
- 124
- 125
- 126
- 127
- 128
- 129
- 130
- 131
- 132
- 133
- 134
- 135
- 136
- 137
- 138
- 139
- 140
- 141
- 142
- 143
- 144
声明:本文内容由网友自发贡献,不代表【wpsshop博客】立场,版权归原作者所有,本站不承担相应法律责任。如您发现有侵权的内容,请联系我们。转载请注明出处:https://www.wpsshop.cn/w/小丑西瓜9/article/detail/728124
推荐阅读
相关标签

