
热门标签
热门文章
- 1【2020年数据分析岗面试题】不断更新...(含自己的理解、思考和简答)_3. 扑克牌54张,平均分成2份,求这2份都有2张a的概率
- 2Microbiome:中国科学家完成鸡肠道微生物宏基因集的构建(一作解读,张和平、魏泓、秦楠点评)_the chicken gut metagenome
- 3android7.0 进程不死,傳奇不死,經典手機 HTC HD2 也裝上了Android 7.0「牛軋糖」
- 4python自定义函数的参数有多种类型_小议Python中自定义函数的可变参数的使用及注意点...
- 5Android AutoLayout全新的适配方式 堪称适配终结者
- 6C#对不同版本IIS的控制方法
- 7什么是TAO以及如何安装和使用TAO_tao-toolkit:5.0.0-pyt 如何使用
- 8写一下在vue中常用的state数据的设计,获取与设置数据。_vue3 中vuex 在actions方法中如何给state属性的值赋值
- 9如何降低aigc总体疑似度_aigc疑似度
- 10谷歌浏览器未发送任何数据_全球市占率第一的谷歌浏览器在测试版中添加IPFS了...
当前位置: article > 正文
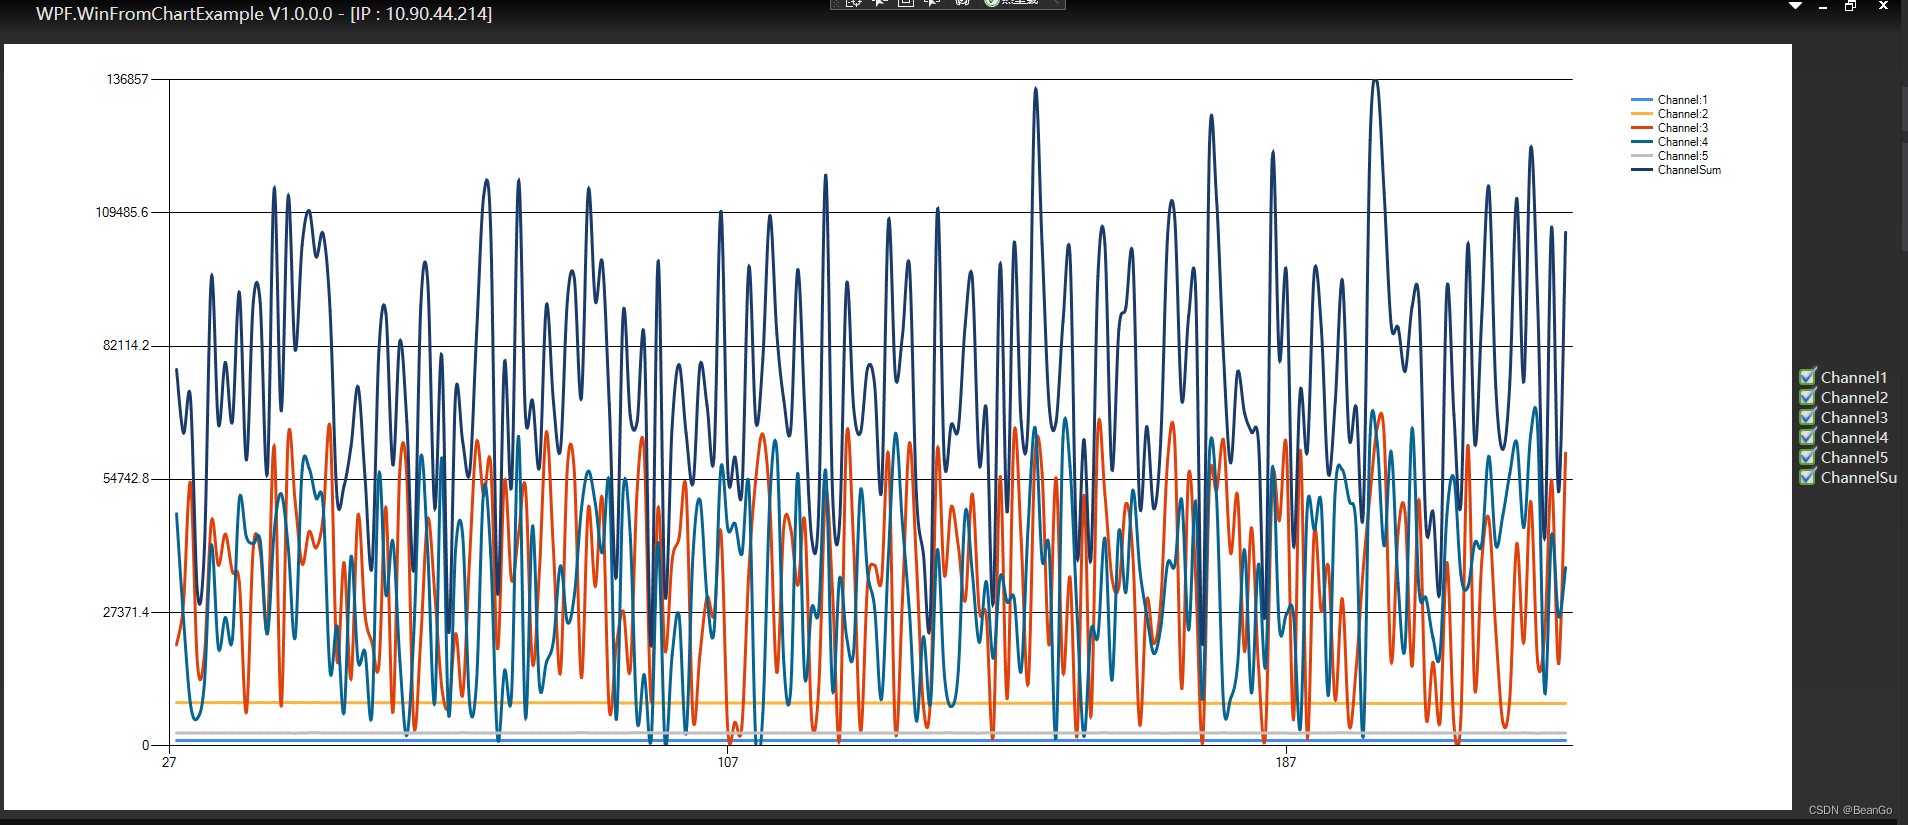
WPF中使用WinForm Chart控件(1)----实时曲线_winform实时曲线图控件
作者:你好赵伟 | 2024-03-20 05:06:06
赞
踩
winform实时曲线图控件
1、首先添加以下四个dll引用
System.Drawing.dll

System.Windows.Forms.dll

WindowsFormsIntegration.dll

System.Windows.Forms.DataVisualization.dll
- 1
- 2
- 3
- 4
- 5
- 6
- 7
2、xml添加命名空间
xmlns:Wchart="clr-namespace:System.Windows.Forms.DataVisualization.Charting;assembly=System.Windows.Forms.DataVisualization"
- 1
3、WPF是不可以直接引用WinForm Chart,但可以托管在WindowsFormsHost中使用,所以我们要添加一个宿主容器
**ps:Windows窗口 设置 AllowsTransparency="False",才能显示Winfrom Chart控件**
- 1
<Grid Margin="4 4 4 2">
  <Grid.ColumnDefinitions>
       <ColumnDefinition/>
       <ColumnDefinition Width="100"/>
   </Grid.ColumnDefinitions>
   <Grid  Margin="5" Background="WhiteSmoke">
       <WindowsFormsHost >
           <Wchart:Chart x:Name="ChartPlot" >
               <!--<Wchart:Chart.ChartAreas>
                       <Wchart:ChartArea>
                           <Wchart:ChartArea.AxisY>
                               <Wchart:Axis></Wchart:Axis>
                           </Wchart:ChartArea.AxisY>
                       </Wchart:ChartArea>
                   </Wchart:Chart.ChartAreas>-->
           </Wchart:Chart>
       </WindowsFormsHost>
   </Grid>
   <StackPanel x:Name="IsEnableChannel" Orientation="Vertical" Grid.Column="1" VerticalAlignment="Center" HorizontalAlignment="Center">

   </StackPanel>
</Grid>

- 1
- 2
- 3
- 4
- 5
- 6
- 7
- 8
- 9
- 10
- 11
- 12
- 13
- 14
- 15
- 16
- 17
- 18
- 19
- 20
- 21
- 22
- 23
4.后台代码.cs添加命名空间
using System.Windows.Forms;
using System.Windows.Forms.DataVisualization.Charting;
- 1
- 2
5、后台代码:
a、图表初始化
 #region 初始化图表

        private ChartArea AREA = new ChartArea() {
    Name = "Line" };             // 画图区域
        private Legend LEGEND = new Legend();                                   // 一个图例

        /// <summary>
        /// 初始化图表
        /// </summary>
        /// <param name="lineCount">线条数</param>
        private void initChart(int lineCount)
        {

            ChartPlot.Series.Clear();                                           //清除线条
            ChartPlot.ChartAreas.Clear();                                       //清除画图区域
            ChartPlot.Legends.Clear();                                          //清除图例

            AREA.AxisX
- 1
- 2
- 3
- 4
- 5
- 6
- 7
- 8
- 9
- 10
- 11
- 12
- 13
- 14
- 15
- 16
- 17
推荐阅读
[详细] -->赞
踩
相关标签

