
热门标签
热门文章
- 1postsql数据库等保测评命令_pgsql等保测评
- 2Software Engineer
- 3当当页面数据抓取备案
- 4【Unity Shader】顶点着色器(Vertex Shader)的概念及其使用示例_顶点shader范例
- 5Android APN开发流程分析_新建apn流程 csdn
- 6python27 pip安装 python2.7安装pip教程
- 7Android Audio知识梳理 看完这一篇就够了!
- 8vscode中C/C++的Clang-format的使用_clangformat配置vscode配置
- 9mysql优化_优化 mysql 及 原因
- 10Windows下安装Mujoco1.50_mujoco windows
当前位置: article > 正文
python使用memory_profiler分析代码运行内存占用_python使用memory profiler
作者:代码探险家 | 2024-08-07 02:03:43
赞
踩
python使用memory profiler
memory_profile
安装
pip install memory_profiler使用
请参考以下文章,写的很详细 【精选】Python代码优化工具——memory_profiler_被Python玩的Kenny的博客-CSDN博客
本文要增加介绍的是API使用
目录结构
- |--my.py
- |--tests
- | |-- test_my_func.py
相关代码
my.py
- def func(x: int, y: int):
- a = [1] * (10**x)
- b = [2] * (2 * 10**y)
- del b
- return a
test_my_func.py
- from memory_profiler import LineProfiler, show_results
-
- from my import func
-
- def test_my_func():
- lp = LineProfiler()
- lp_wrapper = lp(func)
- lp_wrapper(6, **{"y": 7})
- show_results(lp)
执行结果
pytest ./tests/test_my_func.py -s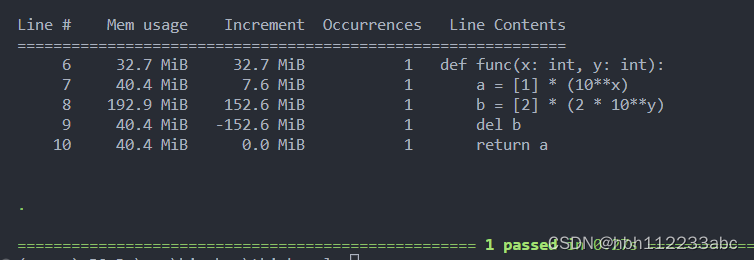
好处
- 以上操作不需要针方法增加装饰器,代码不必反复修改
- 可以结合单元测试,单独运行测试脚本
声明:本文内容由网友自发贡献,不代表【wpsshop博客】立场,版权归原作者所有,本站不承担相应法律责任。如您发现有侵权的内容,请联系我们。转载请注明出处:https://www.wpsshop.cn/w/代码探险家/article/detail/940446
推荐阅读
相关标签

