
热门标签
热门文章
- 1论文《A Neural Influence Diffusion Model for Social Recommendation》阅读
- 2LM详解 GPT3,GPT2, GPT1 论文译读_gpt1源代码
- 3【蓝桥杯】基础训练十进制转十六进制_蓝桥杯c++十进制转十六进制
- 4XAMPP Error: Apache shutdown unexpectedly.This may be due to a blocked port, missing dependencies..._error:apache shut down unexpectedly this may be du
- 5区间预测 | MATLAB实现基于Bootstrap的区间预测_bootstrap区间估计matlab
- 6【EEG信号处理】时频图与时频图的观察_时频特征图
- 7mysql 可重复读和读提交的区别_读已提交与可重复读差别
- 8华为软件开发云又出新服务:开源镜像站正式上线,致敬开源,使能开发者!_华为云镜像站 意义
- 9小程序 底部导航栏(tabBar)图标的正确做法_tabbar图标
- 10【c++】获取电脑硬件信息(操作系统,CPU,内存,GPU,显卡驱动,显示设备分辨率)_c++ 获取硬件信息
当前位置: article > 正文
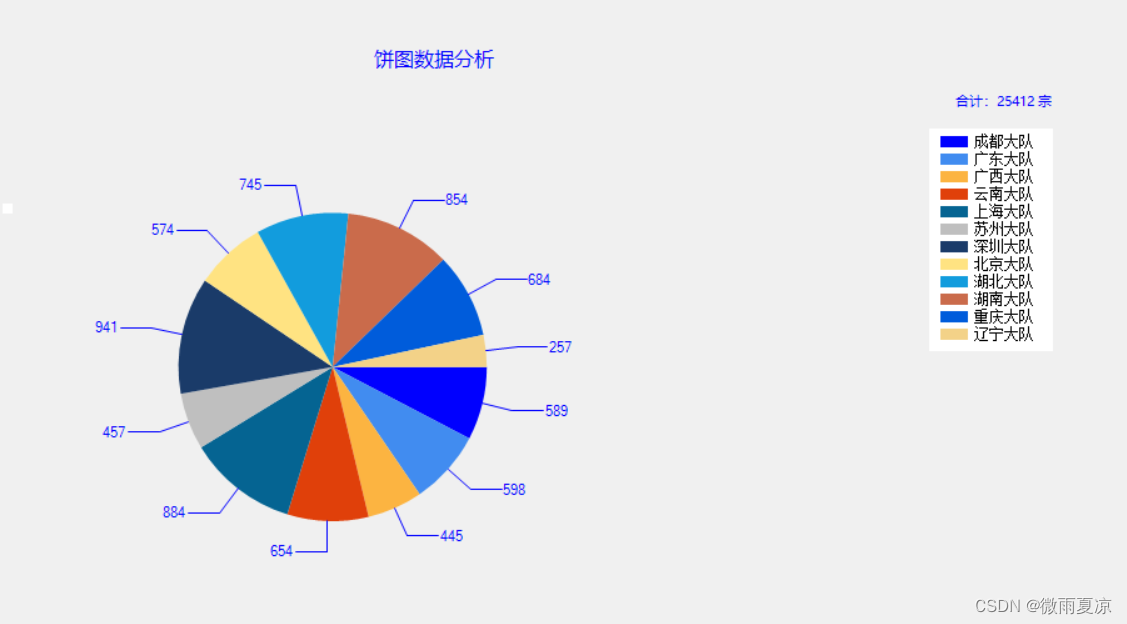
C# Winform Chart控件用法4之饼状图_c# 饼图
作者:不正经 | 2024-03-20 05:05:10
赞
踩
c# 饼图
1、拖chart控件在新建的窗口,命名chart1
2、源代码
- using System;
- using System.Collections.Generic;
- using System.ComponentModel;
- using System.Data;
- using System.Drawing;
- using System.Linq;
- using System.Text;
- using System.Threading.Tasks;
- using System.Windows.Forms;
- using System.Windows.Forms.DataVisualization.Charting;
-
- namespace chart饼状图
- {
- public partial class Form1 : Form
- {
- public Form1()
- {
- InitializeComponent();
- }
-
- private void Form1_Load(object sender, EventArgs e)
- {
-
- string[] x = new string[] { "成都大队", "广东大队", "广西大队", "云南大队", "上海大队", "苏州大队", "深圳大队", "北京大队", "湖北大队", "湖南大队", "重庆大队", "辽宁大队" };
- double[] y = new double[] { 589, 598, 445, 654, 884, 457, 941, 574, 745, 854, 684, 257 };
- string[] z = new string[] { "", "", "", "", "", "", "", "", "", "", "", "" };
-
- string[] a = new string[] { "成都大队", "广东大队", "广西大队", "云南大队", "上海大队" };
- double[] b = new double[] { 541, 574, 345, 854, 257 };
-
- #region 饼状图
-
- //标题
- chart1.Titles.Add("饼图数据分析");
- chart1.Titles[0].ForeColor = Color.Blue;
- chart1.Titles[0].Font = new Font("微软雅黑", 12f, FontStyle.Regular);
- chart1.Titles[0].Alignment = ContentAlignment.TopCenter;
- chart1.Titles.Add("合计:25412 宗");
- chart1.Titles[1].ForeColor = Color.Blue;
- chart1.Titles[1].Font = new Font("微软雅黑", 8f, FontStyle.Regular);
- chart1.Titles[1].Alignment = ContentAlignment.TopRight;
-
- //控件背景
- chart1.BackColor = Color.Transparent;
- //图表区背景
- chart1.ChartAreas[0].BackColor = Color.Transparent;
- chart1.ChartAreas[0].BorderColor = Color.Transparent;
- //X轴标签间距
- chart1.ChartAreas[0].AxisX.Interval = 1;
- chart1.ChartAreas[0].AxisX.LabelStyle.IsStaggered = true;
- chart1.ChartAreas[0].AxisX.LabelStyle.Angle = -45;
- chart1.ChartAreas[0].AxisX.TitleFont = new Font("微软雅黑", 14f, FontStyle.Regular);
- chart1.ChartAreas[0].AxisX.TitleForeColor = Color.Blue;
-
- //X坐标轴颜色
- chart1.ChartAreas[0].AxisX.LineColor = ColorTranslator.FromHtml("#38587a"); ;
- chart1.ChartAreas[0].AxisX.LabelStyle.ForeColor = Color.Blue;
- chart1.ChartAreas[0].AxisX.LabelStyle.Font = new Font("微软雅黑", 10f, FontStyle.Regular);
- //X坐标轴标题
- chart1.ChartAreas[0].AxisX.Title = "数量(宗)";
- chart1.ChartAreas[0].AxisX.TitleFont = new Font("微软雅黑", 10f, FontStyle.Regular);
- chart1.ChartAreas[0].AxisX.TitleForeColor = Color.Blue;
- chart1.ChartAreas[0].AxisX.TextOrientation = TextOrientation.Horizontal;
- chart1.ChartAreas[0].AxisX.ToolTip = "数量(宗)";
- //X轴网络线条
- chart1.ChartAreas[0].AxisX.MajorGrid.Enabled = true;
- chart1.ChartAreas[0].AxisX.MajorGrid.LineColor = ColorTranslator.FromHtml("#2c4c6d");
-
- //Y坐标轴颜色
- chart1.ChartAreas[0].AxisY.LineColor = ColorTranslator.FromHtml("#38587a");
- chart1.ChartAreas[0].AxisY.LabelStyle.ForeColor = Color.Blue;
- chart1.ChartAreas[0].AxisY.LabelStyle.Font = new Font("微软雅黑", 10f, FontStyle.Regular);
- //Y坐标轴标题
- chart1.ChartAreas[0].AxisY.Title = "数量(宗)";
- chart1.ChartAreas[0].AxisY.TitleFont = new Font("微软雅黑", 10f, FontStyle.Regular);
- chart1.ChartAreas[0].AxisY.TitleForeColor = Color.Blue;
- chart1.ChartAreas[0].AxisY.TextOrientation = TextOrientation.Rotated270;
- chart1.ChartAreas[0].AxisY.ToolTip = "数量(宗)";
- //Y轴网格线条
- chart1.ChartAreas[0].AxisY.MajorGrid.Enabled = true;
- chart1.ChartAreas[0].AxisY.MajorGrid.LineColor = ColorTranslator.FromHtml("#2c4c6d");
-
- chart1.ChartAreas[0].AxisY2.LineColor = Color.Transparent;
-
- //背景渐变
- chart1.ChartAreas[0].BackGradientStyle = GradientStyle.None;
-
- //图例样式
- Legend legend2 = new Legend("#VALX");
- legend2.Title = "图例";
- legend2.TitleBackColor = Color.Transparent;
- legend2.BackColor = Color.Transparent;
- legend2.TitleForeColor = Color.Blue;
- legend2.TitleFont = new Font("微软雅黑", 10f, FontStyle.Regular);
- legend2.Font = new Font("微软雅黑", 8f, FontStyle.Regular);
- legend2.ForeColor = Color.Blue;
-
- chart1.Series[0].XValueType = ChartValueType.String; //设置X轴上的值类型
- chart1.Series[0].Label = "#VAL"; //设置显示X Y的值
- chart1.Series[0].LabelForeColor = Color.Blue;
- chart1.Series[0].ToolTip = "#VALX:#VAL(宗)"; //鼠标移动到对应点显示数值
- chart1.Series[0].ChartType = SeriesChartType.Pie; //图类型(折线)
-
- chart1.Series[0].Color = Color.Lime;
- chart1.Series[0].LegendText = legend2.Name;
- chart1.Series[0].IsValueShownAsLabel = true;
- chart1.Series[0].LabelForeColor = Color.Blue;
- chart1.Series[0].CustomProperties = "DrawingStyle = Cylinder";
- chart1.Series[0].CustomProperties = "PieLabelStyle = Outside";
- chart1.Legends.Add(legend2);
- chart1.Legends[0].Position.Auto = true;
- chart1.Series[0].IsValueShownAsLabel = true;
- //是否显示图例
- chart1.Series[0].IsVisibleInLegend = true;
- chart1.Series[0].ShadowOffset = 0;
-
- //饼图折线
- chart1.Series[0]["PieLineColor"] = "Blue";
- //绑定数据
- chart1.Series[0].Points.DataBindXY(x, y);
- chart1.Series[0].Points[0].Color = Color.Blue;
- //绑定颜色
- chart1.Series[0].Palette = ChartColorPalette.BrightPastel;
-
-
-
- #endregion
- }
- }
- }

声明:本文内容由网友自发贡献,不代表【wpsshop博客】立场,版权归原作者所有,本站不承担相应法律责任。如您发现有侵权的内容,请联系我们。转载请注明出处:https://www.wpsshop.cn/w/不正经/article/detail/270908
推荐阅读
[详细] -->赞
踩
相关标签

