
热门标签
热门文章
- 12022危险化学品经营单位主要负责人考试题库及模拟考试_生产经营运输储存使用危险物品或者处置废弃危险物品的行为可能构成
- 2K-Nearest-Neighbors_k nearest neighbor selects all features all a subs
- 35分钟轻松学Python:4行代码写一个爬虫(附零基础学习资料)_爬虫代码
- 4面试经验:字节跳动面试中的难题_字节常考hard题
- 5ERP&EIRP_eirp和erp区别
- 6驱动程序无法通过使用安全套接字层(SSL)加密与 SQL Server 建 立安全连接。错误-“PKIX path building failed-_sqlserver中ssl加密
- 7SpringBoot中进行简单的密码加密_springboot密码加密
- 8Springboot学习笔记(缓存介绍及缓存在springboot中的应用)_springboot如何使用缓存
- 9Java设计模式——单例模式_java单例模式
- 10百度地图js api 为覆盖物添加索引_百度地图覆盖物属性ja
当前位置: article > 正文
用Python 来做Cluster Analysis_python中cluster analysis 的源代码
作者:一键难忘520 | 2024-07-01 01:20:15
赞
踩
python中cluster analysis 的源代码
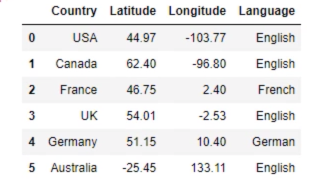
"""
1. Cluster analysis is a multivariate statistical technique that groups observations on the basis some of their features or variables they are described by.
2. Observations in a data set can be divided into different groups and sometimes this is very useful.
3. The final goal of cluster analysis: it is to maximize the similarity of observations within a cluster and maximize the dissimilarity between clusters
4. Classification: Mode (Inputs) -> Outputs -> Correct Values
   Predicting an output category, given input data
5. Clustering: Mode (Inputs) -> Outputs -> ???
   Grouping data points together based on similarities among them and      difference from others.
6. K-means Clustering:
   'K': stands for the number of clusters
7. 要做K-means clustering 的步骤:
   [1] Choose the number of clusters
   [2] Specify the cluster seeds. (Seed is basically a starting centroid)
   [3] Assign each point to a centroid
   [4] Calculate the centroid
   Repeat the last two steps
"""

import pandas as pd
import numpy as np
import matplotlib.pyplot as plt
import seaborn as sns
sns.set()
from sklearn.cluster import KMeans

data = pd.read_csv('3.01. Country clusters.csv')  #Load the data
print (data)
print("*******")

- 1
- 2
- 3
- 4
- 5
- 6
- 7
- 8
- 9
- 10
- 11
- 12
- 13
- 14
- 15
- 16
- 17
- 18
- 19
- 20
- 21
- 22
- 23
- 24
- 25
- 26
- 27
- 28
代码紧接着上面
# Plot the data
plt.scatter(data['Longitude'], data['Latitude'])
plt.xlim(-180,180)
plt.ylim(-90,90)
plt.show()
- 1
- 2
- 3
- 4
- 5

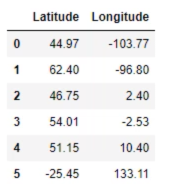
# Select the features
x = data.iloc[:,1:3]
print(x)
- 1
- 2
- 3
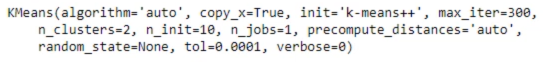
# Clustering
kmeans = KMeans(2)  # The value in brackets in K (the number of clusters)
kmeans.fit(x). #This code will apply k-means clustering with 2 clusters to X
- 1
- 2
- 3
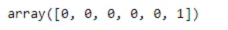
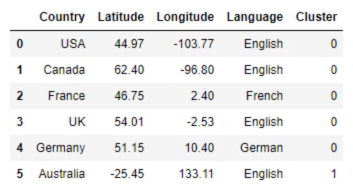
# Clustering results
identified_clusters = kmeans.fit_predict(x)
print(identified_clusters)

data_with_clusters = data.copy()
data_with_clusters['Cluster'] = identified_clusters
print(data_with_clusters)

plt.scatter(data_with_clusters['Longitude'], data_with_clusters['Latitude'])
plt.xlim(-180,180)
plt.ylim(-90,90)
plt.show()

plt.scatter(data_with_clusters['Longitude'], data_with_clusters['Latitude'], c=data_with_clusters['Cluster'], cmap='rainbow')
plt.xlim(-180,180)
plt.ylim(-90,90)
plt.show()
- 1
- 2
- 3
- 4
- 5
- 6
- 7
- 8
- 9
- 10
- 11
- 12
- 13
- 14
- 15
- 16
- 17


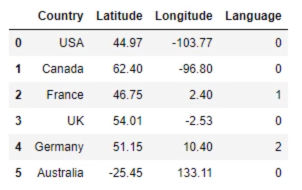
# Map the data
data_mapped = data.copy()
data_mapped['Language'] = data_mapped['Language'].map({'English':0, 'French':1, 'German':2})
print(data_mapped)
- 1
- 2
- 3
- 4
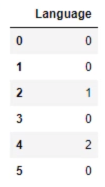
# Select the features
x = data_mapped.iloc[:,3:4]
- 1
- 2
# Clustering
kmeans = KMeans(3)  # The value in brackets in K (the number of clusters)
kmeans.fit(x). #This code will apply k-means clustering with 2 clusters to X

# Clustering results
identified_clusters = kmeans.fit_predict(x)
print(identified_clusters)

data_with_clusters = data.copy()
data_with_clusters['Cluster'] = identified_clusters
print(data_with_clusters)

plt.scatter(data_with_clusters['Longitude'], data_with_clusters['Latitude'])
plt.xlim(-180,180)
plt.ylim(-90,90)
plt.show()

plt.scatter(data_with_clusters['Longitude'], data_with_clusters['Latitude'], c=data_with_clusters['Cluster'], cmap='rainbow')
plt.xlim(-180,180)
plt.ylim(-90,90)
plt.show()
- 1
- 2
- 3
- 4
- 5
- 6
- 7
- 8
- 9
- 10
- 11
- 12
- 13
- 14
- 15
- 16
- 17
- 18
- 19
- 20
- 21


- Distance between points in a cluster, "Within-cluster sum of squares’, or WCSS
- WCSS similar to sst, ssr and sse, WCSS is a measure developed within the ANOVA framework. If we minimize WCSS, we have reached the perfect clustering solution.
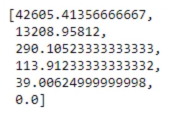
# WCSS
kmeans.inertia_

wcss = []
for i in range(1,7):
  kmeans = KMeans(i)
  kmeans.fit(x)
  wcss_iter = kmeans.inertia_
  wcss.append(wcss_iter)

print(wcss)
- 1
- 2
- 3
- 4
- 5
- 6
- 7
- 8
- 9
- 10
- 11

# The Elbow Method
number_clusters = range(1,7)
plt.plot(number_clusters,wcss)
plt.title('The Elbow Method')
plt.xlabel('Number of clusters')
plt.ylabel('Within-cluster Sum of Squares')
plt.show() # A two cluster solution would be suboptimal as the leap from 2 to 3 is very big
- 1
- 2
- 3
- 4
- 5
- 6
- 7

Pros and Cons of K-Means Clustering:
Pros: 1. Simple to understand
2. Fast to cluster
3. Widely available
4. Easy to implement
5. Always yields a result (Also a con, as it may be deceiving)
| Cons | Remedies |
|---|---|
| 1. We need to pick K | 1. The Elbow method |
| 2. Sensitive to initialization | 2. k-means++ |
| 3. Sensitive to outliers | 3. Remove outliers |
| 4. Produces spherical soulution | |
| 5. Standardization |
声明:本文内容由网友自发贡献,不代表【wpsshop博客】立场,版权归原作者所有,本站不承担相应法律责任。如您发现有侵权的内容,请联系我们。转载请注明出处:https://www.wpsshop.cn/w/一键难忘520/article/detail/774593
推荐阅读
相关标签

