
热门标签
热门文章
- 1python创意小作品100行代码左右,python编程优秀作品_python创意turtle作品和代码
- 2python导入模块语句_python 模块导入详解
- 3ARP协议
- 4常见的限流算法的原理以及优缺点_限流算法优缺点
- 5java判断现在时间是否是某个日期的几天后_java表達式 計算過幾天
- 6互联⽹名词⼤全——商业模式篇_络借贷信息中介服务平台
- 7〖Python 数据库开发实战 - Python与Redis交互篇⑬〗- 综合案例 - 新闻管理系统 - 编辑新闻(编辑角色权限)
- 8Qt5 和 OpenCV4 计算机视觉项目:1~5_qt+opencv通用视觉框架
- 9cck8graphpad作图_北京cck8数据作图「上海儒安生物科技供应」
- 10【Fiddler】iOS机抓取https数据时,失败,全部显示“Tunnel to......443”和手机代理后无法上网的现象_ios抓包全是urnnel to
当前位置: article > 正文
传统方法分割三维点云——几何分割_o3d.geometry.trianglemesh.create_cylinder设置
作者:Monodyee | 2024-03-13 14:20:15
赞
踩
o3d.geometry.trianglemesh.create_cylinder设置
基于几何特征的分割方法
基于几何特征的分割方法是最早被提出和广泛应用的方法之一。它通过计算点云中的几何属性,如法向量、曲率等,来进行分割。其中,最常用的方法包括:
1.1 基干法向量的分割方法
该方法假设同一区域的法向量相似,通过计算点云中每个点的法向量,将相似法向量的点划分为同一区域。优点是简单易实现,但对于复杂场景或存在噪声的点云效果较差。
1.2 基于曲率的分割方法
该方法通过计算点云中每个点的曲率,将曲率变化较大的点划分为不同区域。优点是对于不同形状的物体有较好的分割效果,但对于噪声点较敏感。
传统方法对于噪声比较多的点云数据处理起来都较为复杂的,而在降噪过程中由于点云的无序性和无规则性,对于去噪后的结果无法保证,因此,传统方法分割点云的困难重重。
本文从几何分割的角度出发,充分利用物体几何特征,对于矩形物体进行了几何分割,以下是算法过程:
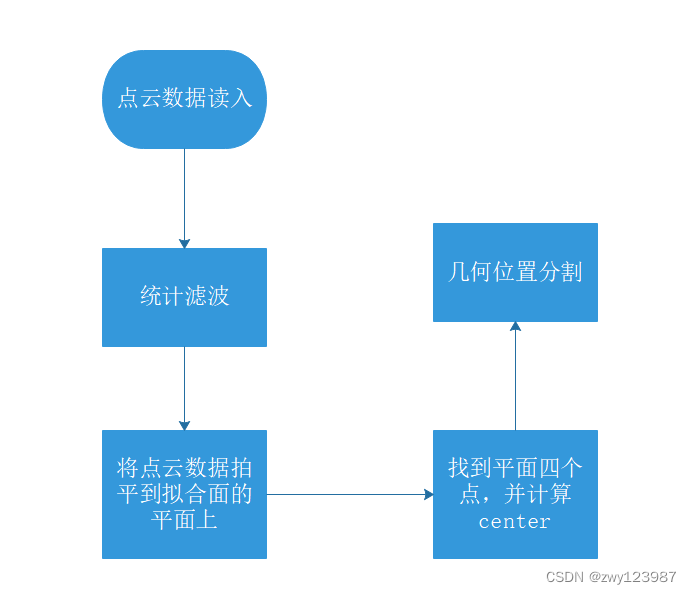
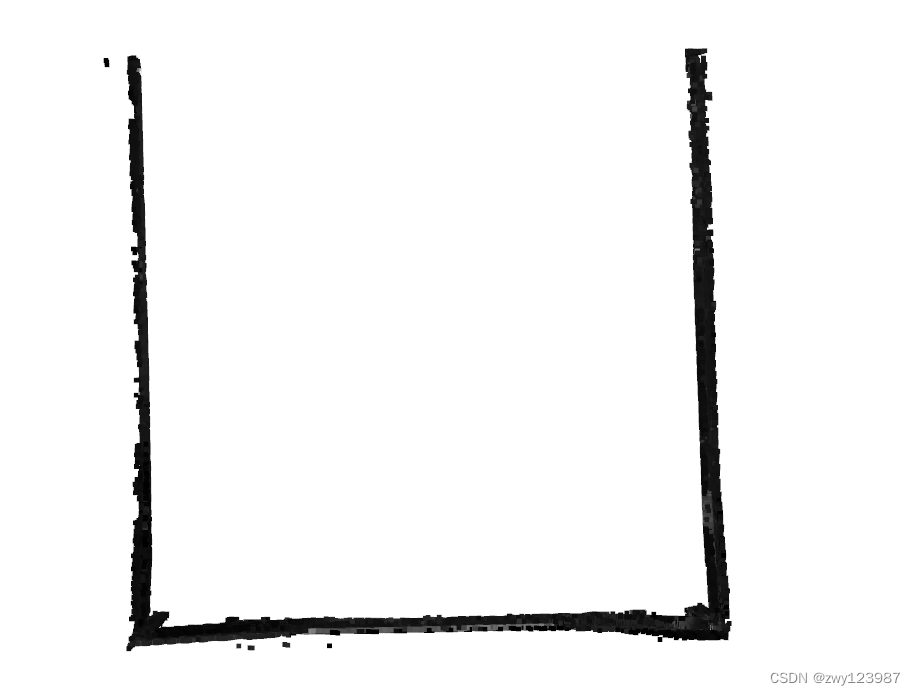
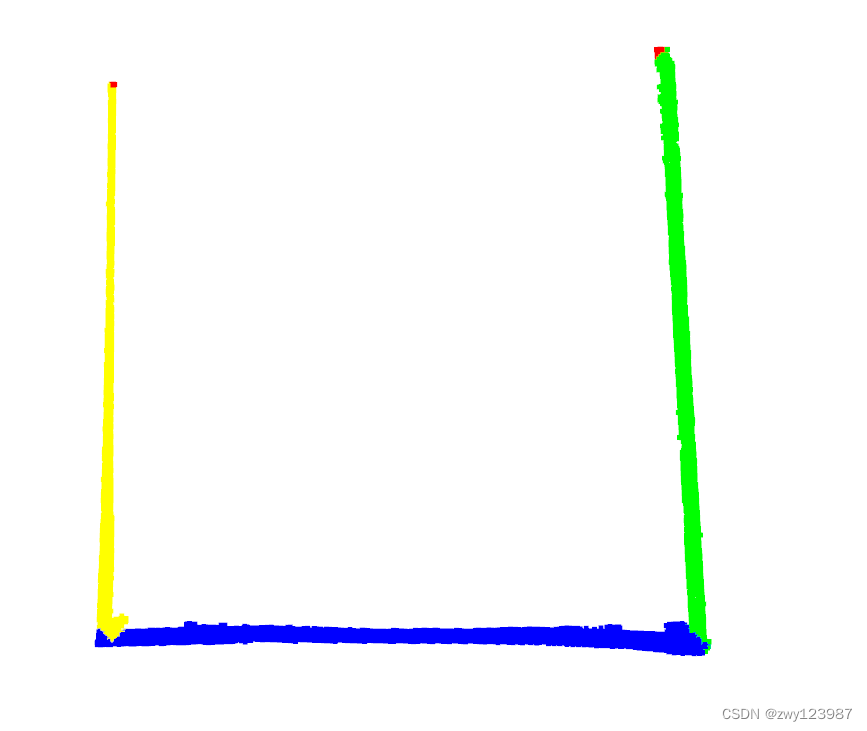
最后得到的数据分割情况如下,可以分割出三个面的点云数据,正上方的点云数据粉色块部分,是该程序也适用于四个面的矩形点云数据。
结果如下:
代码附上:
- import open3d as o3d
- import numpy as np
- import pyransac3d as pyrsc
-
- def line_fit(pcd,classified_points):
- """
- 直线拟合
- """
- for i, points in classified_points.items():
- # 创建点云对象
- point_cloud = o3d.geometry.PointCloud()
- # 将numpy点云数据赋值给点云对象
- point_cloud.points = o3d.utility.Vector3dVector(points)
- print("->正在直线拟合...")
- mesh_cylinders = []
- line = pyrsc.Line()
- # A:直线的斜率,B:直线的截距,inliers:内点索引,
- # thresh:内点的距离阈值
- # maxIteration:RANSAC算法的拟合次数
- A, B, inliers = line.fit(points, thresh=500, maxIteration=500)
- print('直线的三维斜率为:', A)
- print('直线的截距为:', B)
- R = pyrsc.get_rotationMatrix_from_vectors([0, 0, 1], A)
- ransac_line = point_cloud.select_by_index(inliers)
-
- mesh_cylinder = o3d.geometry.TriangleMesh.create_cylinder(radius=20, height=10000)
- mesh_cylinder.compute_vertex_normals()
- mesh_cylinder.paint_uniform_color([1, 0, 0])
- mesh_cylinder = mesh_cylinder.rotate(R, center=[0, 0, 0])
- mesh_cylinder = mesh_cylinder.translate((B[0], B[1], B[2]))
- o3d.visualization.draw_geometries([point_cloud, ransac_line, mesh_cylinder])
- def classifiction_points(pcd,wall_corners):
- '''
- 根据四面墙的四个角点,将四面墙的点云数据分为四块。
- '''
- # 计算中心点
- center_point = np.mean(wall_corners, axis=0)
- # 将每个角点向中心点移动1cm
- moved_corners = []
- for corner in wall_corners:
- direction_to_center = center_point - corner
- # 单位化方向向量
- unit_direction = direction_to_center / np.linalg.norm(direction_to_center)
- # 移动1cm
- moved_corner = corner + unit_direction * 1
- moved_corners.append(moved_corner)
-
- moved_corners = np.array(moved_corners)
- # points_cloud是一个Numpy数组,包含点云数据
- points_cloud = np.array(pcd.points)
-
- # 分类点云数据
- classified_points = {i: [] for i in range(4)}
- for point in points_cloud:
- # 对每个点,找到最近的延长线
- min_distance = float('inf')
- min_index = -1
- for i in range(4):
- corner1 = moved_corners[i]
- corner2 = moved_corners[(i + 1) % 4]
- # 计算点到延长线的距离
- distance = np.linalg.norm(np.cross(corner2 - corner1, corner1 - point)) / np.linalg.norm(corner2 - corner1)
- if distance < min_distance:
- min_distance = distance
- min_index = i
- # 添加到对应分类中
- classified_points[min_index].append(point)
-
- # 将分类转换为Numpy数组
- for i in range(4):
- classified_points[i] = np.array(classified_points[i])
- # 定义每个分类的颜色 (r, g, b)
- colors = [
- [1, 0, 0], # 红色
- [0, 1, 0], # 绿色
- [0, 0, 1], # 蓝色
- [1, 1, 0] # 黄色
- ]
- # 创建一个Open3D的点云对象列表
- point_cloud_objects = []
- for i, points in classified_points.items():
- # 创建点云对象
- point_cloud = o3d.geometry.PointCloud()
- # 将numpy点云数据赋值给点云对象
- point_cloud.points = o3d.utility.Vector3dVector(points)
- # 为点云赋予颜色
- point_cloud.paint_uniform_color(colors[i])
- # 将点云对象添加到列表中
- point_cloud_objects.append(point_cloud)
-
- # 可视化所有分类的点云
- o3d.visualization.draw_geometries(point_cloud_objects)
- return classified_points
-
- def find_farthest_points_in_quadrants(points, center):
- # 初始化四个象限的最远点信息
- quadrants = {
- 'upper_left': (-np.inf, None),
- 'upper_right': (-np.inf, None),
- 'lower_right': (-np.inf, None),
- 'lower_left': (-np.inf, None)
- }
-
- for point in points:
- # 计算点到中心点的角度和距离
- angle = np.arctan2(point[1] - center[1], point[0] - center[0])
- distance = np.linalg.norm(point - center)
-
- # 确定点所在的象限,并更新该象限的最远点
- if -np.pi <= angle < -np.pi / 2:
- if distance > quadrants['lower_left'][0]:
- quadrants['lower_left'] = (distance, point)
- elif -np.pi / 2 <= angle < 0:
- if distance > quadrants['lower_right'][0]:
- quadrants['lower_right'] = (distance, point)
- elif 0 <= angle < np.pi / 2:
- if distance > quadrants['upper_right'][0]:
- quadrants['upper_right'] = (distance, point)
- elif np.pi / 2 <= angle <= np.pi:
- if distance > quadrants['upper_left'][0]:
- quadrants['upper_left'] = (distance, point)
-
- # 从四个象限中提取最远的点
- farthest_points = [quadrants[q][1] for q in quadrants]
- return np.array(farthest_points)
-
-
- def visualize_points_and_lines(pcd_clap,points, lines):
- # 从点集创建点云对象
- pcd = o3d.geometry.PointCloud()
- pcd.points = o3d.utility.Vector3dVector(points)
-
- # 从点集和线集创建线集对象
- line_set = o3d.geometry.LineSet(
- points=o3d.utility.Vector3dVector(points),
- lines=o3d.utility.Vector2iVector(lines)
- )
-
- # 可视化点云和线集
- o3d.visualization.draw_geometries([pcd_clap,pcd, line_set])
-
-
- class Ransac_fit():
- def __init__(self,pointcloud):
- """
- 初始化参数
- """
- self.pcd = pointcloud # 输入点云
- self.NPt = 0 # 输入点云
- self.NpPoints = np.asarray(self.pcd.points) # 点云numpy数组
- self.min_height = 0 # 点云最小高度
- self.max_height = 0 # 点云最大高度
-
- def get_min_max_horizontal_height(self):
- """
- 求得点云的最低和最高的Z值
- """
- obb = self.pcd.get_axis_aligned_bounding_box()
- # 从包围盒坐标中获取最高和最低水平高度
- obb_points = np.asarray(obb.get_box_points())
- self.min_height = np.min(obb_points[:, 2]) # 最低水平高度
- self.max_height = np.max(obb_points[:, 2]) # 最高水平高度
-
- def clap_top_bottom(self):
- """
- 沿着z轴拍平点云数据
- """
- pointsID_Window = []
- # 遍历所有点,并记录符合条件的点的索引
- for idx, point in enumerate(self.NpPoints):
- if self.min_height <= point[2] <= self.max_height:
- point[2] = 0
- pointsID_Window.append(idx)
-
- pcd_clap = self.pcd.select_by_index(pointsID_Window).voxel_down_sample(3)
- return pcd_clap
-
- def plane_fit(self,distance_threshold,ransac_n,num_iterations):
- """
- 拍平平面到原来的平面
- """
- distance_threshold = 5 if distance_threshold == 0 else distance_threshold
- ransac_n = 5 if ransac_n == 0 else ransac_n
- num_iterations = 1000 if num_iterations == 0 else num_iterations
- segment_models, inliers = self.pcd.segment_plane(distance_threshold, ransac_n, num_iterations)
- # 获取平面的法向量并归一化
- normal_vector = np.array(segment_models[:3])
- normal_vector /= np.linalg.norm(normal_vector)
- # 计算每个点在法向量方向上的分量
- dot_products = np.dot(self.NpPoints, normal_vector)
- # 计算投影点
- projected_points = self.NpPoints - 0.8 * dot_products[:, np.newaxis] * normal_vector
- # 创建新的PointCloud对象
- projected_pcd = o3d.geometry.PointCloud()
- projected_pcd.points = o3d.utility.Vector3dVector(projected_points)
- return projected_pcd
-
- def main():
- # 确保文件路径是正确的
- file_path = r"C:\Users\zhaojunzhe\Desktop\点云数据存储\钢梁.pts"
- # 读取点云数据
- pcd = o3d.io.read_point_cloud(file_path)
- o3d.visualization.draw_geometries([pcd])
- # 点云滤波
- cl, ind = pcd.remove_statistical_outlier(nb_neighbors=20, std_ratio=2.0)
- pcd = pcd.select_by_index(ind)
- # 创建拍平点云数据去拟合
- RANSAC = Ransac_fit(pcd)
- RANSAC.get_min_max_horizontal_height()
- clap_pointcloud = RANSAC.plane_fit(distance_threshold = 0,ransac_n = 0,num_iterations = 0)
- # 给点云上色
- colored_pcd = clap_pointcloud.paint_uniform_color([0, 0, 1])
- # 给定点云数据
- points = np.array(colored_pcd.points)
- # 计算点云数据的中心
- point_cloud_center = np.mean(points,axis = 0)
- # 找到相对于中心点在四个象限中距离最远的四个点
- farthest_points = find_farthest_points_in_quadrants(points[:, :3], point_cloud_center[:3])
- # 点云数据分类
- classified_points = classifiction_points(colored_pcd,farthest_points)
- # 最后三部分未来得及根据分割后的物体修改完善,请读者自行完善修改!
- # RANSAC线拟合
- line_fit(colored_pcd,classified_points)
- # 定义连接最远点的线集
- lines = [[i, (i + 1) % 4] for i in range(4)]
- # 可视化中心点、最远点和连接线
- visualize_points_and_lines(colored_pcd,farthest_points, lines)
-
- if __name__ == '__main__':
- main()

数据已上传到百度网盘,链接地址如下,自取。
链接:https://pan.baidu.com/s/1qqX-J3WTecIbWPE6vvvCfw?pwd=142t
提取码:142t
--来自百度网盘超级会员V2的分享
声明:本文内容由网友自发贡献,不代表【wpsshop博客】立场,版权归原作者所有,本站不承担相应法律责任。如您发现有侵权的内容,请联系我们。转载请注明出处:https://www.wpsshop.cn/w/Monodyee/article/detail/228957
推荐阅读
相关标签

