
热门标签
热门文章
- 1图像质量评价:感知建模vs机器学习【VALSE Webinar】Panel实录
- 2SpringBoot集成Elasticsearch(三)——ElasticSearchRestTemplate类与ElasticsearchRepository类_spring boot集成elasticsearchrepository
- 3mac下安装android studio 遇到问题及解决方案_jetbrains toolbox app无法安装android studio
- 4理解和使用alsa配置-默认静音,必须先用amixer解除主音量和pcm音量的静音_alsa声卡配置模块
- 5Android studio打包生成jar包文件_android studio生成jar包
- 6Linux 中的权限(0755或0644或-rwxr-xr-x)_文件权限0755
- 7【TCN回归预测】基于雾凇算法优化时间卷积网络结合多头注意力机制RIME-TCN-Multihead-Attention实现电力负荷预测附matlab代码
- 8[android UI]应用程序自适应屏幕大小_app inventor 手机屏幕尺寸
- 9ArkTS的状态管理机制(State)_arkts state是对象
- 10ElasticsearchStatusException[Elasticsearch exception [type=invalid_index_name_exception, reason=Inva...
当前位置: article > 正文
关于YOLOv5训练结果results.txt绘制对比图_yolov5 result图
作者:IT小白 | 2024-03-29 22:41:35
赞
踩
yolov5 result图
目录
用两个results.txt在一幅图中画2条对比曲线
- # -*- coding:utf-8 -*-
- import matplotlib.pyplot as plt
- import numpy as np
-
-
- column = ['epoch', 'train_GIOU_loss', 'train_obj_loss', 'train_cls_loss', 'total', 'target', 'img_size', 'precision',
- 'recall', 'MAP@0.5', 'F1', 'val_GIOU_loss', 'val_obj_loss', 'val_cls_loss']
-
-
- def plot_result(result1, result2, title, yl):
- ind = column.index(title) # 获取索引
- plt.rcParams['font.sans-serif'] = 'Times New Roman'
- plt.figure(figsize=(10, 8), dpi=400)
- x = result1[range(0, 60, 5), 0]
- y1 = result1[range(0, 60, 5), ind]
- y2 = result2[range(0, 60, 5), ind]
- line1 = plt.plot(x, y1, color="#8B4513", linewidth=2, label="yolov5", marker='^')
- line2 = plt.plot(x, y2, color="#90EE90", linewidth=2, label="advanced yolov5", marker='^')
- plt.xticks(range(0, 60, 5), fontsize=14)
- plt.yticks(fontsize=14)
- plt.xlabel('epoch', fontsize=16)
- plt.ylabel(yl, fontsize=16)
- plt.legend(loc="best", fontsize=16, frameon=False)
- plt.savefig('总损失对比图')
- plt.show()
-
-
- # 获取results文件中的有效列并且新增epoch序号列
- def result2matrix(result_dir, epoch_num):
- data = np.genfromtxt(result_dir)
- result = data[0:epoch_num + 1, 2:15] # 获取数据
- print(f"\n一共{len(result)}个epoches的结果")
- epoch = np.arange(len(result)) # 生成epoch序号
- epoch = epoch.reshape(len(result), 1)
- result = np.hstack((epoch, result)) # 新添一列epoch
- return result
-
-
- def plot_yolov5_curves(txt_dir1, txt_dir2):
- output1 = result2matrix(txt_dir1, epoch_num=60)
- output2 = result2matrix(txt_dir2, epoch_num=60)
- plot_result(output1, output2, 'total', 'total_loss')
-
-
-
- '''
- 一共11个图,可根据自己要求拓展
- '''
- if __name__ == '__main__':
- dir1 = "results1.txt"
- dir2 = "results2.txt"
- plot_yolov5_curves(dir1, dir2)

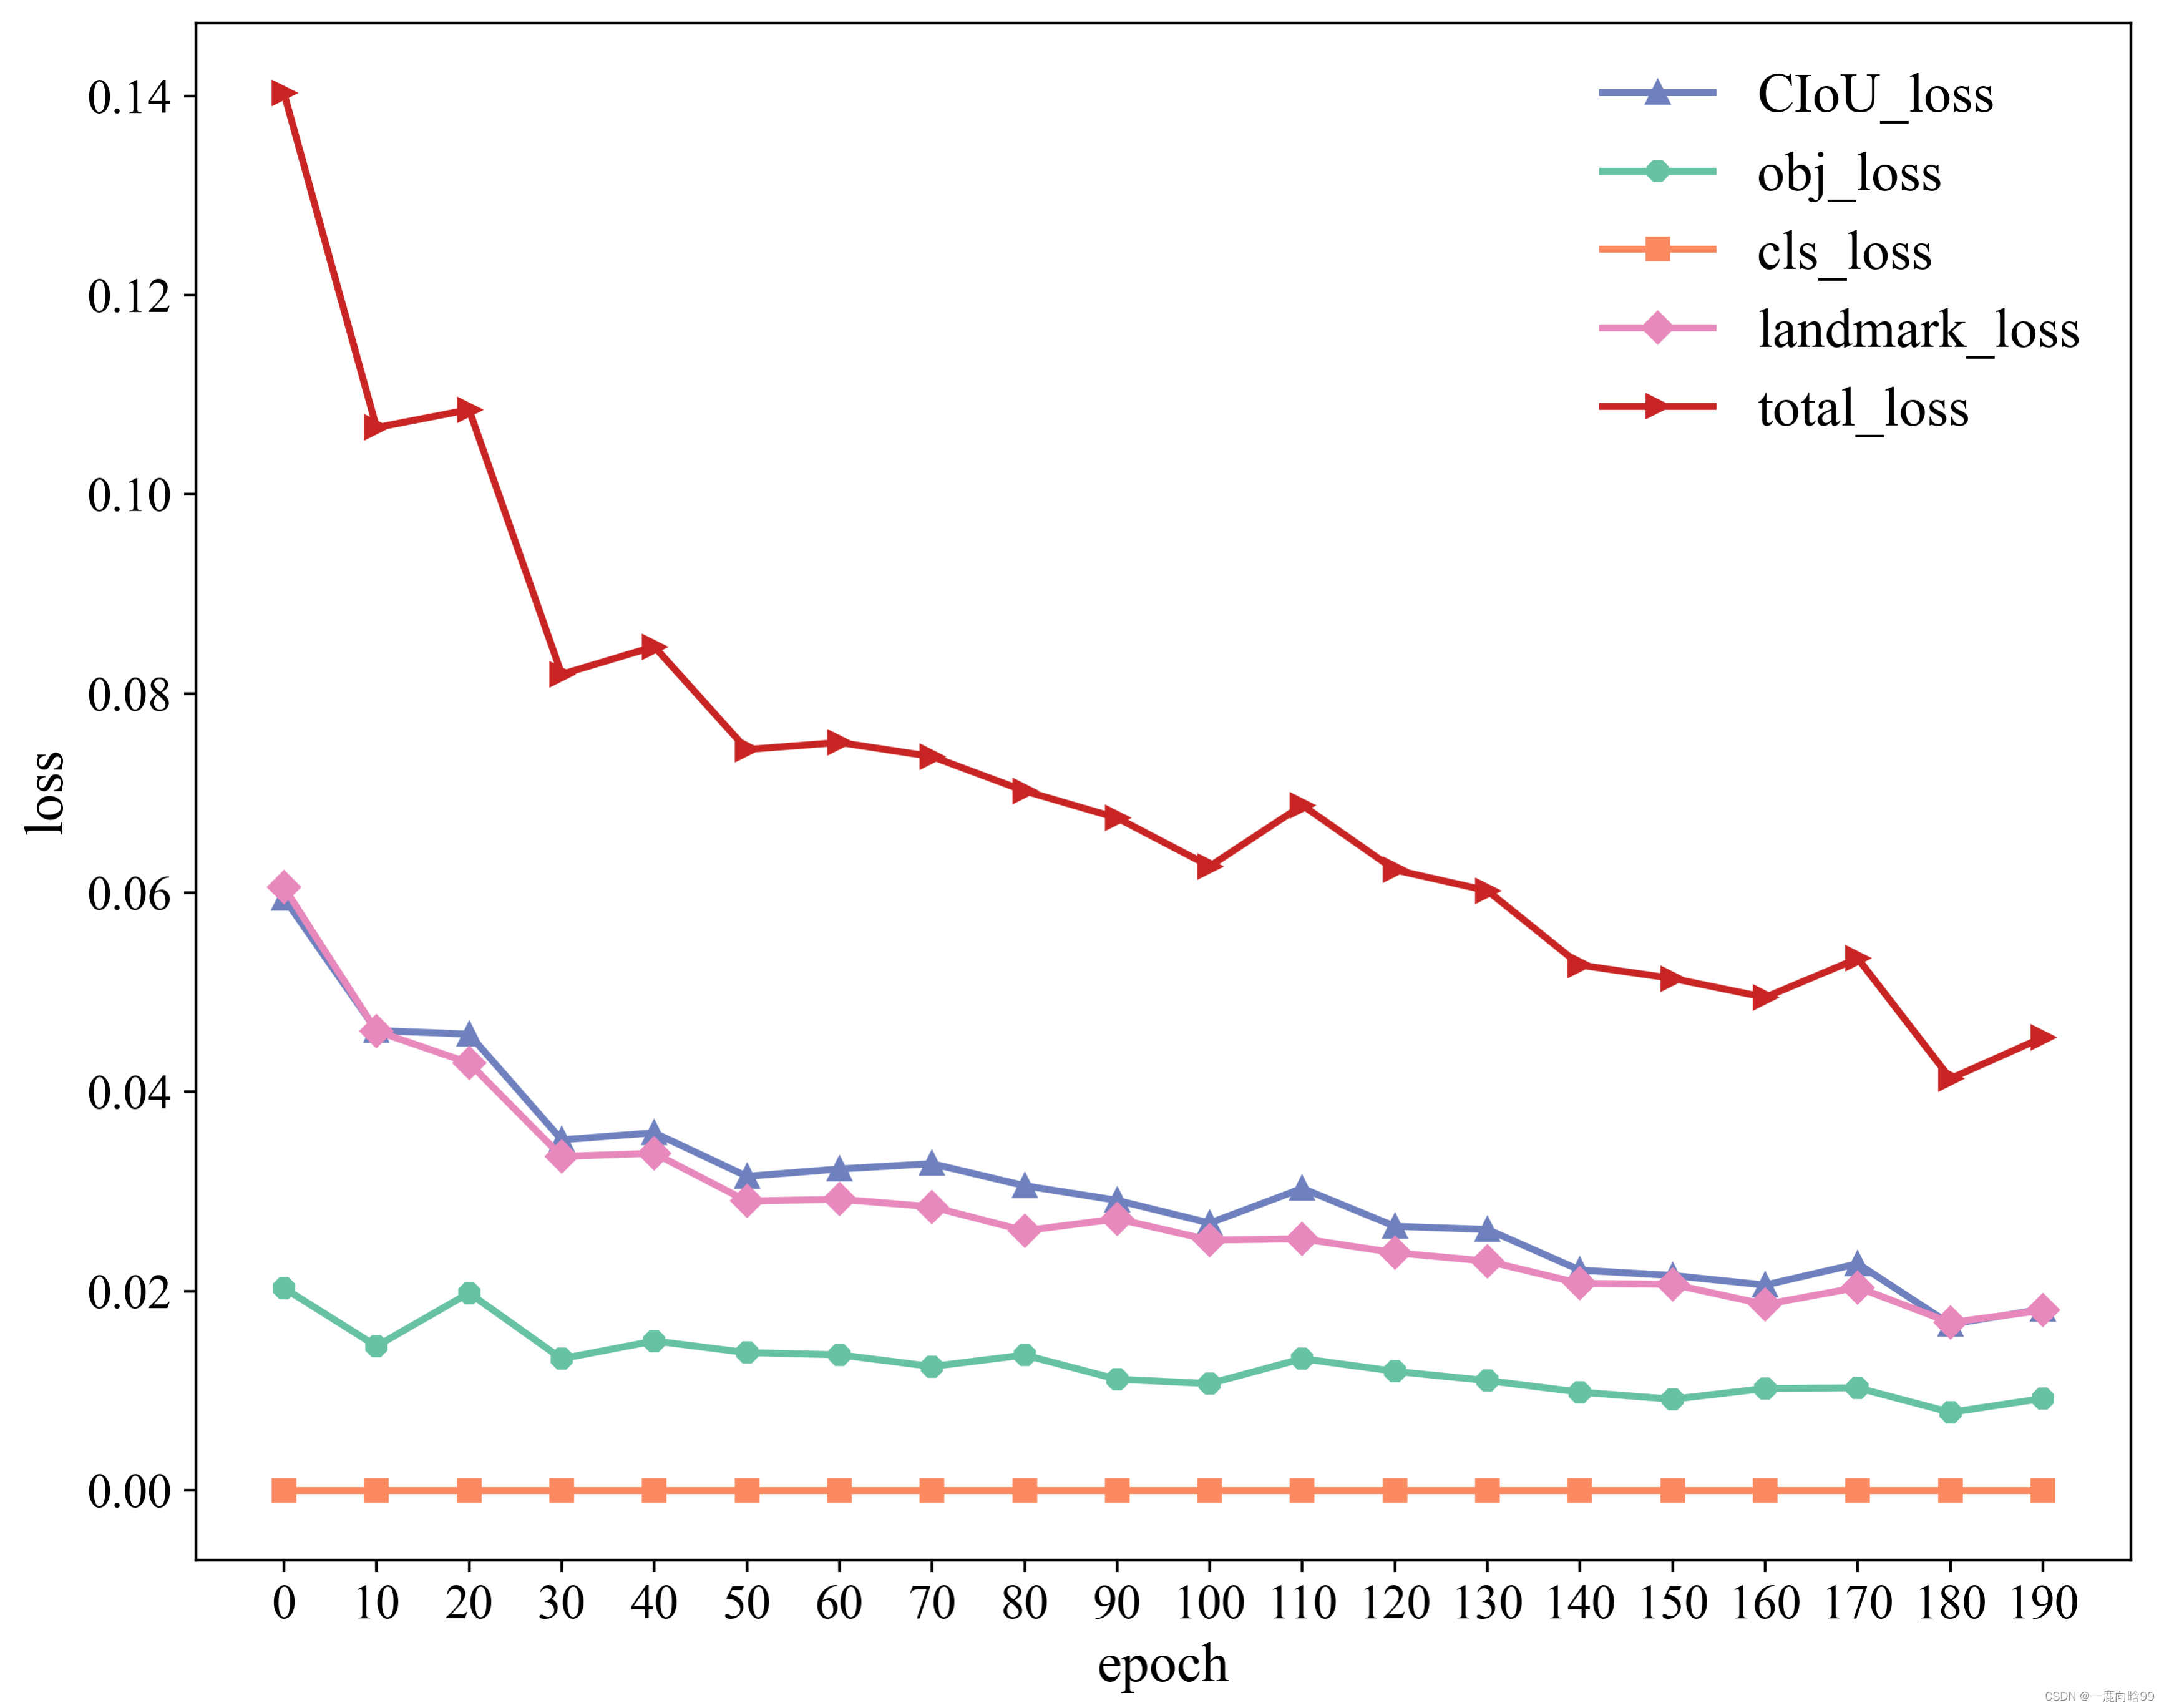
用一个results.txt在一幅图中画多条对比曲线:
- # -*- coding:utf-8 -*-
- import matplotlib.pyplot as plt
- import numpy as np
-
-
- column = ['epoch', 'train_GIOU_loss', 'train_obj_loss', 'train_cls_loss', 'train_landmark_loss', 'total', 'target', 'img_size', 'precision',
- 'recall', 'MAP@0.5', 'F1', 'val_GIOU_loss', 'val_obj_loss', 'val_cls_loss']
-
- # 同一幅图中画多条曲线
- def plot_result(result1, yl):
- ind1 = column.index('train_GIOU_loss') # 获取giou索引
- ind2 = column.index('train_obj_loss') # 获取obj索引索引
- ind3 = column.index('train_cls_loss') # 获取cls索引
- ind4 = column.index('train_landmark_loss') # 获取landmark索引
- ind5 = column.index('total') # 获取total索引
- plt.rcParams['font.sans-serif'] = 'Times New Roman'
- plt.figure(figsize=(10, 8), dpi=400)
- x = result1[range(0, 200, 10), 0]
- # 每条损失曲线对应的y值
- y1 = result1[range(0, 200, 10), ind1]
- y2 = result1[range(0, 200, 10), ind2]
- y3 = result1[range(0, 200, 10), ind3]
- y4 = result1[range(0, 200, 10), ind4]
- y5 = result1[range(0, 200, 10), ind5]
-
- # 画giou
- line1 = plt.plot(x, y1, color="#6F80BE", linewidth=2, label="CIoU_loss", marker='^')
- # 画obj
- line2 = plt.plot(x, y2, color="#67C2A3", linewidth=2, label="obj_loss", marker='8')
- # 画cls
- line3 = plt.plot(x, y3, color="#FC8A61", linewidth=2, label="cls_loss", marker='s')
- # 画landmark
- line4 = plt.plot(x, y4, color="#E889BD", linewidth=2, label="landmark_loss", marker='D')
- # 画total
- line5 = plt.plot(x, y5, color="#C82423", linewidth=2, label="total_loss", marker='>')
-
- plt.xticks(range(0, 200, 10), fontsize=14)
- plt.yticks(fontsize=14)
- plt.xlabel('epoch', fontsize=16)
- plt.ylabel(yl, fontsize=16)
- plt.legend(loc="best", fontsize=16, frameon=False)
- plt.savefig('损失对比图')
- plt.show()
-
-
- # 获取results文件中的有效列并且新增epoch序号列
- def result2matrix(result_dir, epoch_num):
- data = np.genfromtxt(result_dir)
- result = data[0:epoch_num + 1, 2:16] # 获取数据
- print(f"\n一共{len(result)}个epoches的结果")
- epoch = np.arange(len(result)) # 生成epoch序号
- epoch = epoch.reshape(len(result), 1)
- result = np.hstack((epoch, result)) # 新添一列epoch
- return result
-
-
- def plot_yolov5_curves(txt_dir1):
- output1 = result2matrix(txt_dir1, epoch_num=200)
- plot_result(output1, 'loss')
-
- '''
- 一共11个图,可根据自己要求拓展
- '''
- if __name__ == '__main__':
- dir1 = "results.txt"
- plot_yolov5_curves(dir1)
-
-
示例如下:
声明:本文内容由网友自发贡献,转载请注明出处:【wpsshop】
推荐阅读
相关标签

