
热门标签
热门文章
- 1ViLD: Vision and Language Knowledge Distillation_vision and language distillation
- 2华为手机什么时候更新鸿蒙系统_华为鸿蒙2.0系统什么时候可以用 华为鸿蒙2.0系统升级方法介绍[多图]...
- 3Python从0到100(六):Python分支和循环结构的应用
- 4对比自监督学习综述 - A Survey of Contrastive Self-Supervised Learning_memory bank classification
- 5解决pyqt5过段时间自己崩了,打不开QT designer的问题_pyqt5太容易崩溃了
- 6JavaScript小实例——制作页面定时弹出广告_js中3. 模仿一个弹窗广告案例 - 需求: - 页面打开一段时间以后(5 ~10s), 右下角出
- 7【自然语言处理】之——NLTK工具包使用过程中遇到的问题_nltk.download
- 8【鸿蒙开发】在ArkTS线程中通过napi创建的C++线程返回处理结果_鸿蒙napi返回对象
- 9【起草】1-2 讨论 ChatGPT 在自然语言处理领域的重要性和应用价值_《鳖哲法典》
- 10【零基础深度学习教程第三课:神经网络训练优化】_梯度下降法训练神经网络最大迭代次数、学习率一般设置为多少
当前位置: article > 正文
R使用netmeta程序包实现生存数据的频率学网状meta分析
作者:Gausst松鼠会 | 2024-03-29 03:26:23
赞
踩
R使用netmeta程序包实现生存数据的频率学网状meta分析
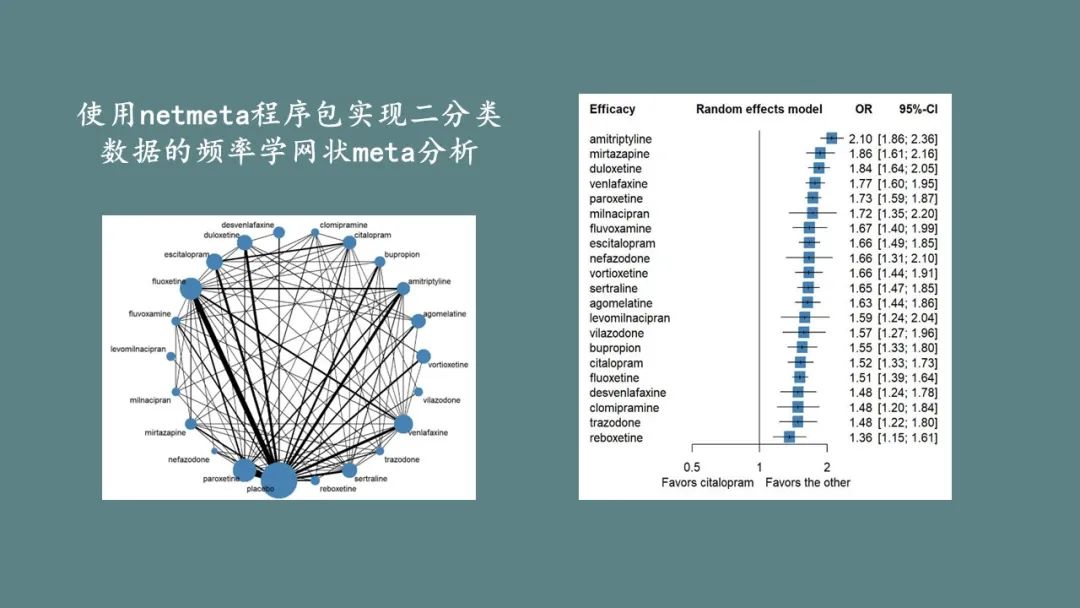
之前的推文系统的介绍了使用netmeta包实现对二分类变量、连续型变量和罕见事件的网状meta分析。今天的文章介绍如何使用netmeta程序包实现生存数据的频率学网状meta分析,用来评估6种免疫疗法( Camrelizumab、Tislelzumab、Toripalimab、Sintilimab、Pembrolizumab、Nivolumab)联合化疗方案治疗一线晚期或转移性鳞状食管癌的NMA。
1. 程序包加载及数据加载
- library(netmeta)
- OS <- read_csv("netmeta.csv")
2. 模型构建
使用netmeta函数构建NMA分析模型,其中TE = log(HR),seTE = (log(upperCI) - log(lowerCI))/3.92)
- m.netmeta <- netmeta(TE = TE, # TE = log(HR)
- seTE = seTE, # seTE = (log(upperCI) - log(lowerCI))/3.92)
- treat1 = treat1,
- treat2 = treat2,
- studlab = study,
- data = OS,
- sm = "HR",
- reference.group = "che",
- sep.trts = " vs ")
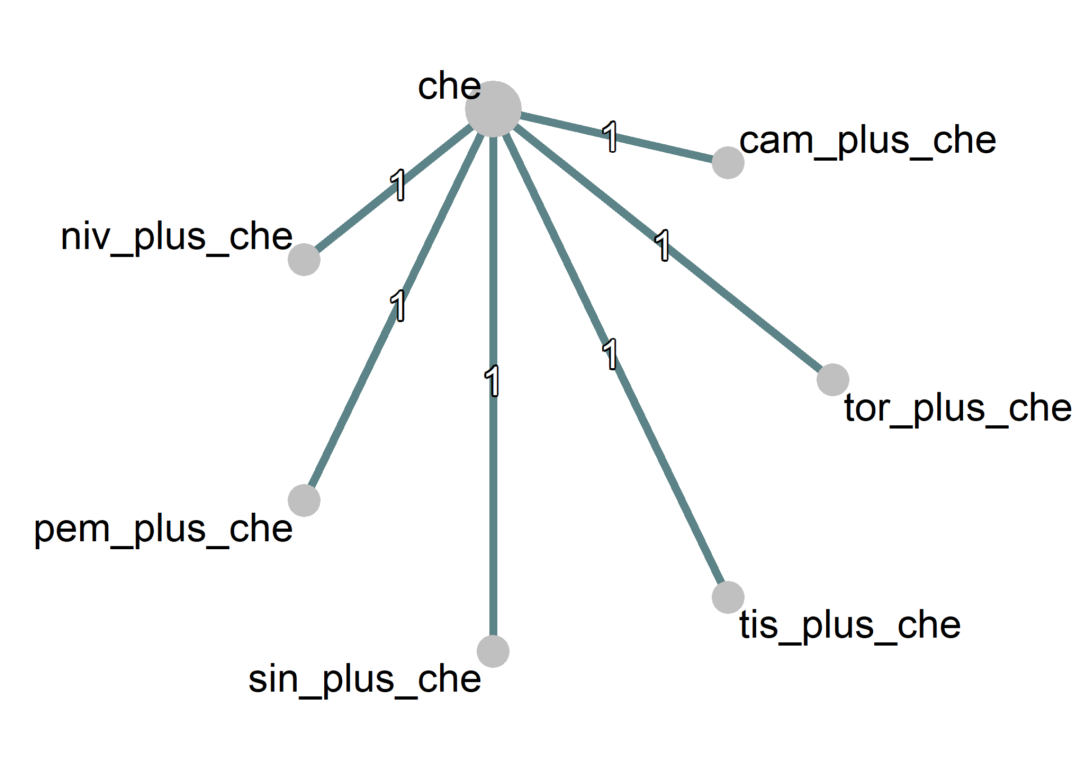
3. 网络证据绘制
使用netgraph函数绘制网络证据图
- netgraph(m.netmeta,
- points=T,
- plastic=F,
- col = "#5C8286",
- col.points = "#BFBFBF",
- bg.points = "#5C8286",
- number.of.studies = T,
- cex=1.5,
- cex.points=c(4,7,4,4,4,4,4))
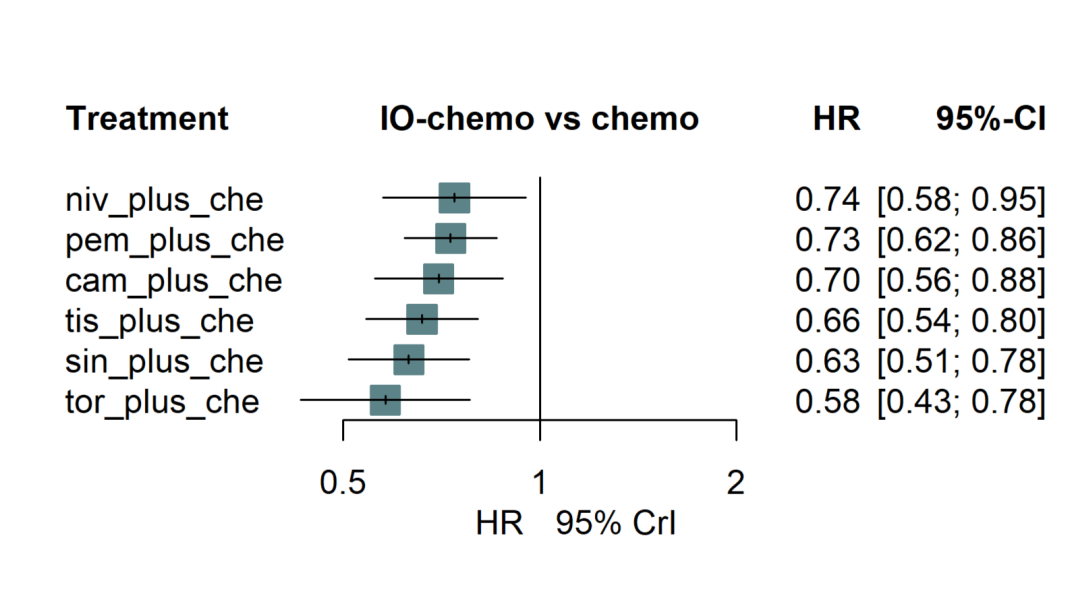
4. 森林图绘制
使用forest函数绘制森林图
- forest(m.netmeta,
- reference.group = "che",
- smlab = paste("IO-chem vs chemo"),
- drop.reference.group = TRUE,
- label.left = "HR",
- col.square = "#5C8286",
- drop = TRUE,
- sortvar = -TE,
- label.right = "95% CrI")
5. 两两比较赛联表制作
使用 netleague函数计算两两比较结果
- netleague <- netleague(m.netmeta,
- bracket = "(",
- digits=2)
- # netleague
- write.csv(netleague$random, "netleague.csv")
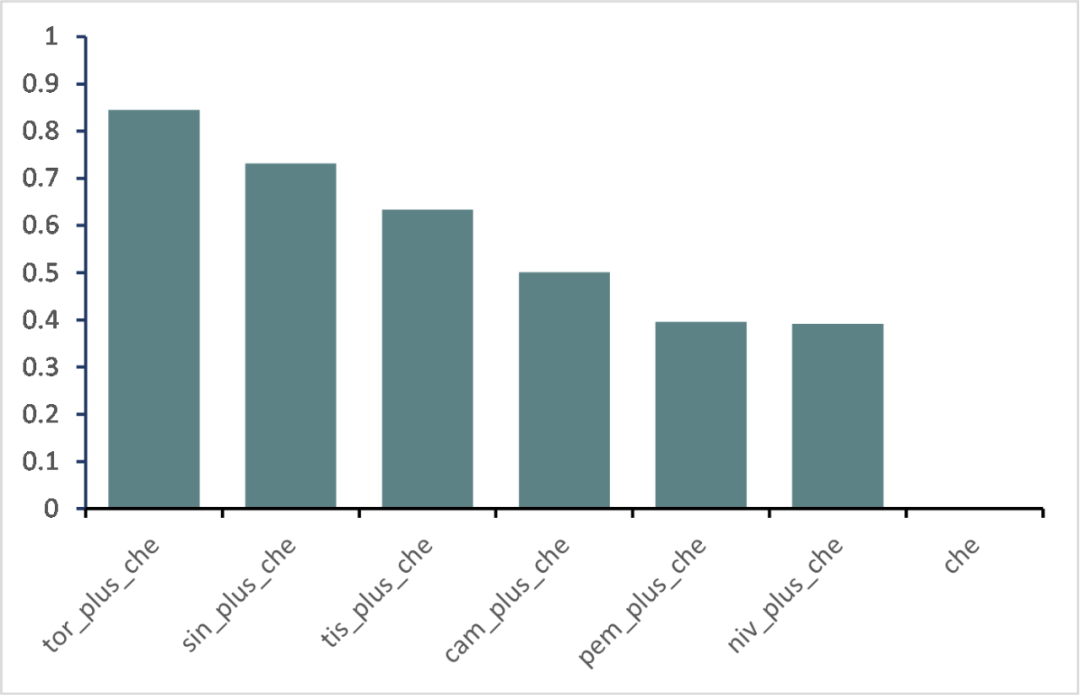
6. 排序(SURCA )
使用netrank函数计算累积概率并绘制条形排序图
netrank(m.netmeta, small.values = "good")
- P-score (common) P-score (random)
- tor_plus_che 0.8446 0.8446
- sin_plus_che 0.7316 0.7316
- tis_plus_che 0.6340 0.6340
- cam_plus_che 0.5010 0.5010
- pem_plus_che 0.3954 0.3954
- niv_plus_che 0.3917 0.3917
- che 0.0018 0.0018
参考文献
[1] Gao, Tian-Tian et al. “Comparative efficacy and safety of immunotherapy for patients with advanced or metastatic esophageal squamous cell carcinoma: a systematic review and network Meta-analysis.” BMC cancer vol. 22,1 992. 17 Sep. 2022, doi:10.1186/s12885-022-10086-5IF: 3.8 Q2.
推荐阅读
相关标签

