
热门标签
热门文章
- 1mysql——排序(窗口函数)_mysql排名窗口函数
- 2安卓项目包命名规范及常见项目架构
- 3C语言编程规范学习笔记和总结(附华为编程规范机试参考试题)_华为c语言编程规范
- 4前端之用HTML做一个汇款单
- 5Android UI: 自定义控件:可换行的布局控件
- 6Android 异常解决方法汇总_android so va_arg 异常
- 7Could not resolve type alias ''. Cause: java.lang.ClassNotFoundException: Cannot find class:_could not resolve type alias 'sysconfig'. cause: j
- 8【错误】controller中接口参数:Liat<对象>_resolved [org.springframework.web.method.annotatio
- 9在Matplotlib绘图中添加Latex风格公式_matplotlib label插入latex公式
- 10阿里云文件上传与删除_aliyunupload.vod
当前位置: article > 正文
在WPF中使用Livechart写一个简单的柱状图_livecharts库绘制树状图
作者:2023面试高手 | 2024-03-20 04:49:57
赞
踩
livecharts库绘制树状图
首先,你需要在你的WPF项目中安装LiveCharts NuGet包。你可以通过NuGet包管理器搜索“LiveCharts.Wpf”来安装它。
然后,在XAML文件中添加一个CartesianChart控件:
- <Window x:Class="WpfApp12.MainWindow"
- xmlns="http://schemas.microsoft.com/winfx/2006/xaml/presentation"
- xmlns:x="http://schemas.microsoft.com/winfx/2006/xaml"
- xmlns:d="http://schemas.microsoft.com/expression/blend/2008"
- xmlns:mc="http://schemas.openxmlformats.org/markup-compatibility/2006"
- xmlns:lvc="clr-namespace:LiveCharts.Wpf;assembly=LiveCharts.Wpf"
- xmlns:local="clr-namespace:WpfApp12"
- mc:Ignorable="d"
- Title="MainWindow" Height="450" Width="800">
- <Grid>
- <lvc:CartesianChart Series="{Binding SeriesCollection}" LegendLocation="Right"/>
- </Grid>
- </Window>
接下来,在你的ViewModel类中创建一个SeriesCollection属性,并在构造函数中初始化它:
- using LiveCharts;
- using LiveCharts.Wpf;
-
- public class MainViewModel
- {
- public SeriesCollection SeriesCollection { get; set; }
-
- public MainViewModel()
- {
- SeriesCollection = new SeriesCollection
- {
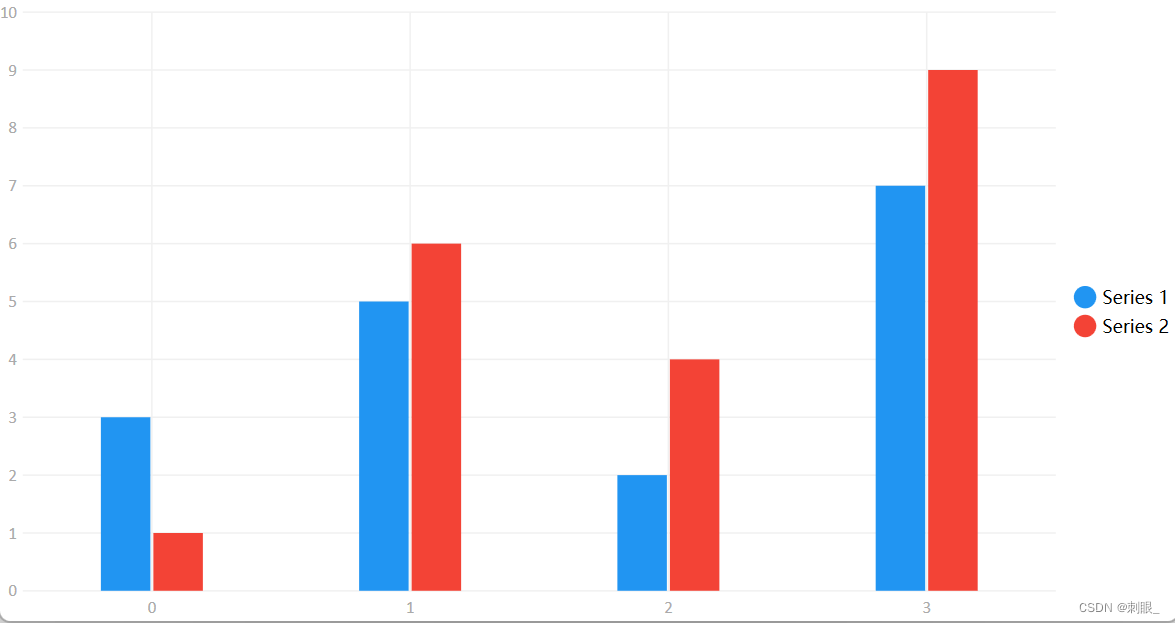
- new ColumnSeries
- {
- Title = "Series 1",
- Values = new ChartValues<double> { 3, 5, 2, 7 }
- }
- ,
- new ColumnSeries
- {
- Title = "Series 2",
- Values = new ChartValues<double> { 1, 6, 4, 9 }
- }
- };
- }
- }

这里我们创建了一个包含一个ColumnSeries的SeriesCollection。ColumnSeries表示柱状图,Title属性是这个系列的标题,Values属性是这个系列的数据。
最后,在MainWindow的构造函数中将ViewModel设置为DataContext:
- public MainWindow()
- {
- InitializeComponent();
- DataContext = new MainViewModel();
- }
现在你应该可以运行这个程序并看到一个简单的柱状图:
声明:本文内容由网友自发贡献,转载请注明出处:【wpsshop博客】
推荐阅读
相关标签

