- 1MCU学习笔记_SPI_mcu读取设置msb有什么用
- 2一文讲清Python的7大学习路线(建议收藏)_python技术栈学习路线
- 3R语言基础学习-02 (此语言用途小众 用于数学 生物领域 基因分析)
- 4揭秘AI魔法绘画:Stable Diffusion引领无限创意新纪元_ai绘画教程:文生图+图生图+提示词+模型训练+插件应用
- 5飞腾服务器通过KunLun BIOS 对JBOD模式的系统盘进行格式化,删除系统盘中残留数据的操作方法_飞腾服务器如何格式化硬盘
- 6AI:06-基于OpenCV的二维码识别技术的研究_opencv识别二维码原理
- 7若依ruoyi框架实现单点登录或者接入统一认证_若依单点登录
- 8pytorch并行报错RuntimeError: unable to write to file</torch_xxx>_runtimeerror: unable to write to file
- 9面试必备:分库分表经典15连问_分库分表面试题
- 102023年第2季社区Task挑战赛升级新玩法,等你来战!_bcos3 复杂查询
性能测试-JMeter分布式测试及其详细步骤
赞
踩
性能测试概要
性能测试是软件测试中的一种,它可以衡量系统的稳定性、扩展性、可靠性、速度和资源使用。它可以发现性能瓶颈,确保能满足业务需求。很多系统都需要做性能测试,如Web应用、数据库和操作系统等。
性能测试种类非常多,有些概念也很相近:
Load Testing
Baseline Testing
Smoke Testing
Stress Testing
Soak Testing
Endurance Testing
Capacity Testing
Longevity Testing
Peak Testing
Spike Testing
Volume Testing
Capacity Tests
Reliability Testing
Scalability Testing
性能测试的工具
同样,性能测试的工具也非常多:
Apache JMeter
HP LoadRunner
Gatling
Blazemeter
k6
NeoLoad
TestComplete
Silk Performer
Rational Performance Tester
Apica LoadView
AppDynamics
Dynatrace
New Relic
很难说哪个工具是最好的,这取决于你的需求和预算。如果你想要开源易用的,那JMeter是一个不错的选择。如果你想要一个商用的工具,不妨试试LoadRunner和NeoLoad。重要的一点是,没有任何一款工具可以应对所有性能测试,很多时候我们需要组合使用。
JMeter的分布式测试
我将在本文详细介绍JMeter的分布式测试,我们经常会通过它来做性能测试。
在分布式测试角色中,我们需要一个控制节点Controller,还有多个工作节点Workers。如果你想你的请求增加,那可以通过不断增加工作节点来实现。Controller控制Workers,但它不跑具体的测试案例。Workers是连接目标系统来做具体测试的。
整个系统架构大概如下:
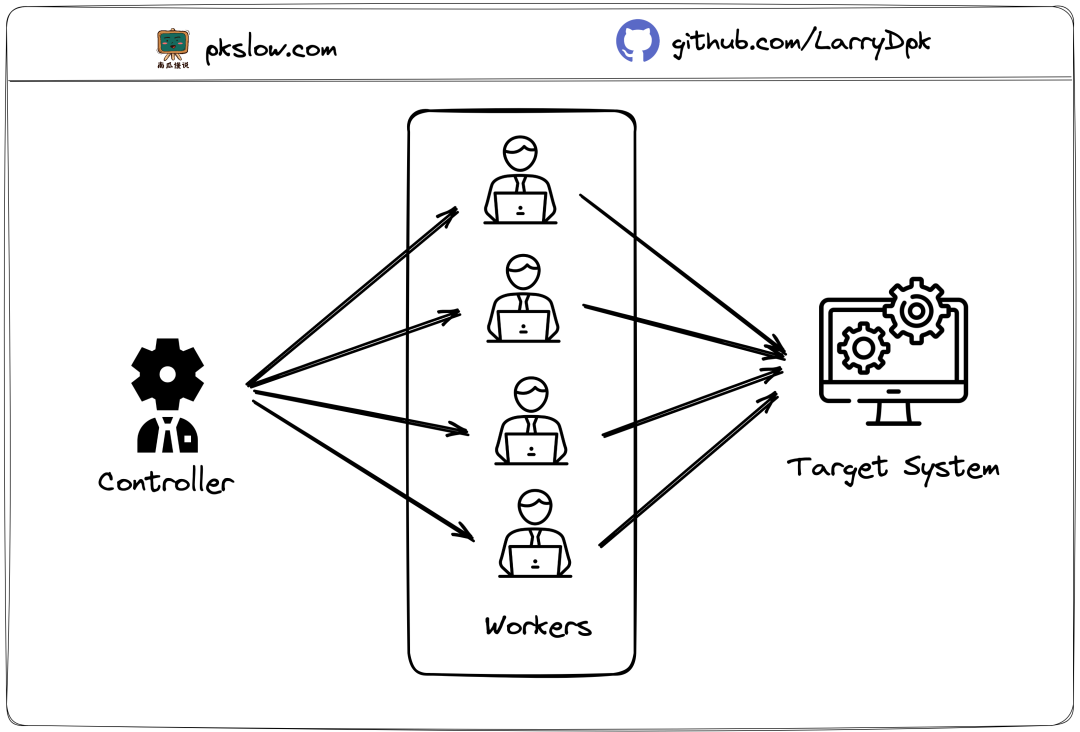
Worker可以在不同的服务器上,所以叫分布式,也因此可以利用多台电脑的资源来模拟足够的请求。
详细步骤
我将一步步介绍如何使用JMeter分布式测试来做性能测试,大致架构如下:
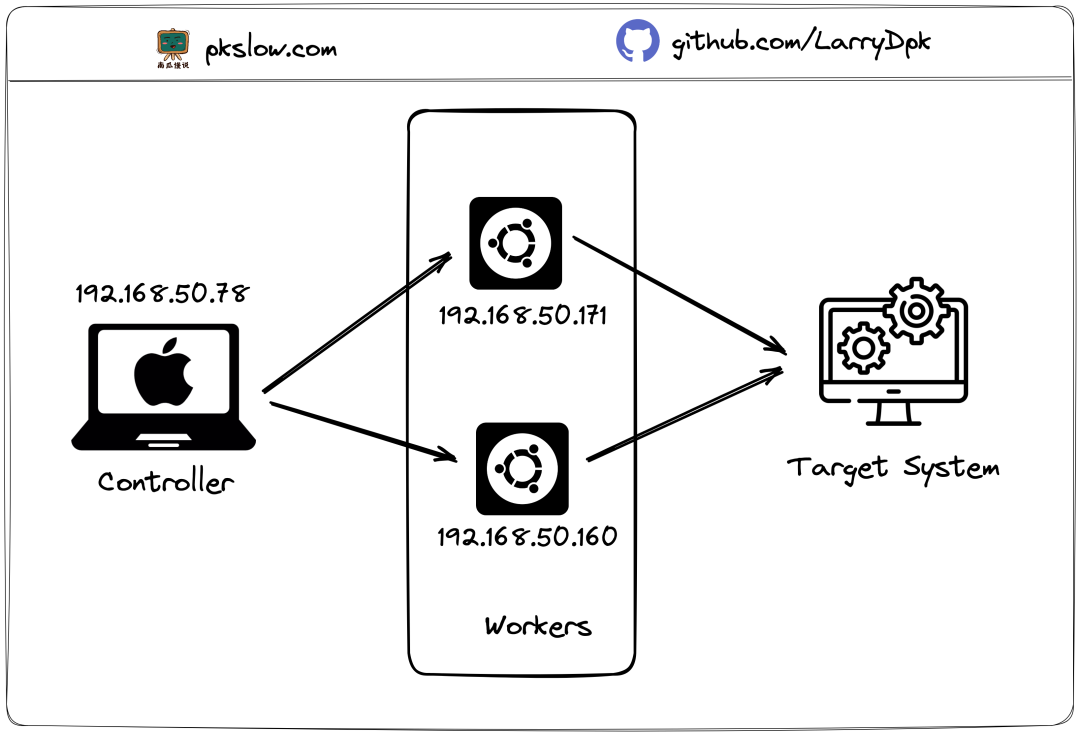
Controller我放在Mac上跑,Workers我是通过两台Ubuntu服务器来跑,要注意它们的IP是在同一内网上的。目标系统为了省事,我直接请求 Bing, stackoverflow, QQ。
Step 1: 安装JDK
Apache JMeter是用Java写的,运行它需要Java运行环境。在Ubuntu安装如下:
sudo apt install openjdk-11-jdk
Stpe 2: 下载Apache JMeter
去官网的 download page 下载最新的JMeter包apache-jmeter-5.5.zip,然后解压:
unzip apache-jmeter-5.5.zip
所有节点都需要下载安装。
Controller的位置如下:
/Users/larry/Software/apache-jmeter-5.5
Workers的位置如下:
home/larry/software/apache-jmeter-5.5
你不必位置和我一样,我列出来是为了与后面的命令对应上。
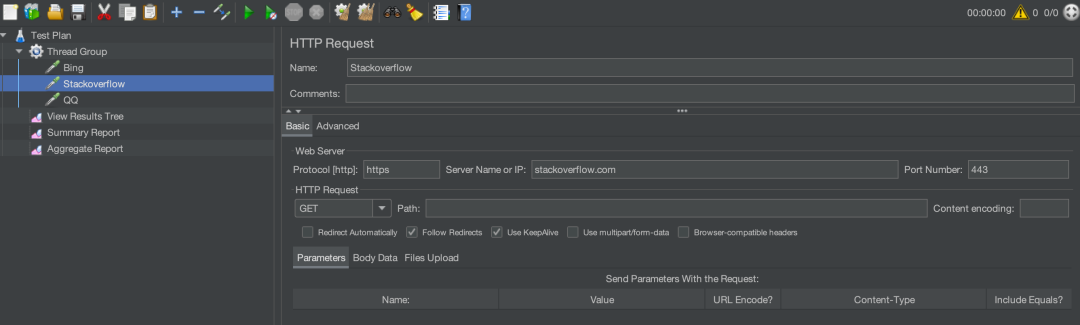
Step 3: 准备测试的JMX文件
JMeter把所有的测试信息都存放在jmx文件中,打开工具写测试案例如下:
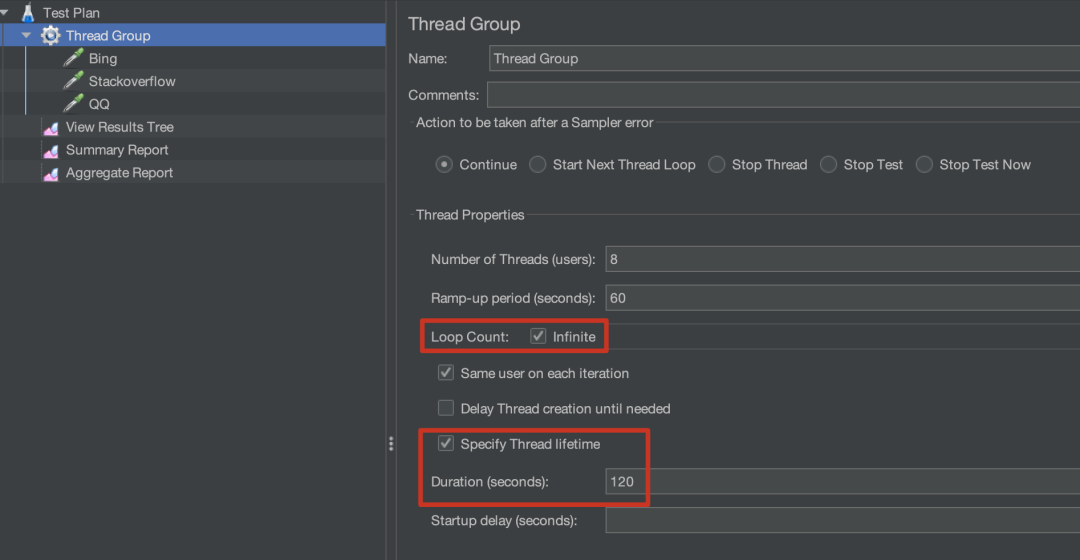
然后定义整个测试怎么跑,这里定义的是使用8个线程,60秒的热身和120秒的持续时长:
文件我放在这:
- $ ls /Users/larry/Software/apache-jmeter-5.5/projects/pkslow
- performance-test.jmx
我的案例只是Controller需要这个jmx文件,Worker是不需要的。它们可以通过RMI来交互。
Step 4: 启动Workers
要先启动Workers,以服务器模式来启动,启动后不会执行什么测试,它会等待与它连接的Controller和指令:
Worker 1:
- $ /home/larry/software/apache-jmeter-5.5/bin/jmeter-server -Dserver.rmi.ssl.disable=true -Djava.rmi.server.hostname=192.168.50.171
- Created remote object: UnicastServerRef2 [liveRef: [endpoint:[192.168.50.171:41709](local),objID:[-2af2edf6:1882245cfde:-7fff, 1980465993472976097]]]
Worker 2:
- $ /home/larry/software/apache-jmeter-5.5/bin/jmeter-server -Dserver.rmi.ssl.disable=true -Djava.rmi.server.hostname=192.168.50.60
- Created remote object: UnicastServerRef2 [liveRef: [endpoint:[192.168.50.60:45337](local),objID:[18489452:1882246a88b:-7fff, 4749047852254882466]]]
“注意: 可能会遇到java.rmi.RemoteException,如果你没指定参数:java.rmi.server.hostname.
- $ ./software/apache-jmeter-5.5/bin/jmeter-server -Dserver.rmi.ssl.disable=true
- May 15, 2023 5:43:16 PM java.util.prefs.FileSystemPreferences$1 run
- INFO: Created user preferences directory.
- Created remote object: UnicastServerRef2 [liveRef: [endpoint:[127.0.1.1:33021](local),objID:[-7155c199:1881ecaf233:-7fff, -6972385484103483700]]]
- Server failed to start: java.rmi.RemoteException: Cannot start. ubuntu is a loopback address.
- An error occurred: Cannot start. ubuntu is a loopback address.
Step 5: 启动Controller
所有Workers就位后,就等主帅一声令下。启动时要指定jmx文件,报告生成的位置,还有Worker的IP,如下:
- $ cd /Users/larry/Software/apache-jmeter-5.5/
-
- $ ./bin/jmeter -n -t projects/pkslow/performance-test.jmx -l projects/pkslow/performance-test.csv -e -o projects/pkslow/Reports -Dserver.rmi.ssl.disable=true -R 192.168.50.171,192.168.50.60
- Creating summariser <summary>
- Created the tree successfully using projects/pkslow/performance-test.jmx
- Configuring remote engine: 192.168.50.171
- Configuring remote engine: 192.168.50.60
- Starting distributed test with remote engines: [192.168.50.171, 192.168.50.60] @ May 16, 2023 10:37:31 PM CST (1684247851079)
- Remote engines have been started:[192.168.50.171, 192.168.50.60]
- Waiting for possible Shutdown/StopTestNow/HeapDump/ThreadDump message on port 4445
- summary + 1 in 00:00:02 = 0.7/s Avg: 1260 Min: 1260 Max: 1260 Err: 0 (0.00%) Active: 2 Started: 2 Finished: 0
- summary + 111 in 00:02:31 = 0.7/s Avg: 4433 Min: 41 Max: 50474 Err: 4 (3.60%) Active: 15 Started: 16 Finished: 1
- summary = 112 in 00:02:33 = 0.7/s Avg: 4405 Min: 41 Max: 50474 Err: 4 (3.57%)
- summary + 64 in 00:00:19 = 3.3/s Avg: 25706 Min: 62 Max: 66745 Err: 31 (48.44%) Active: 0 Started: 16 Finished: 16
- summary = 176 in 00:02:52 = 1.0/s Avg: 12151 Min: 41 Max: 66745 Err: 35 (19.89%)
- Tidying up remote @ May 16, 2023 10:40:24 PM CST (1684248024629)
- ... end of run

更多信息可以查看 jmeter.log:
- $ tail -f jmeter.log
- 2023-05-16 22:40:29,956 INFO o.a.j.r.d.JsonExporter: Found data for consumer statisticsSummary in context
- 2023-05-16 22:40:29,957 INFO o.a.j.r.d.JsonExporter: Creating statistics for overall
- 2023-05-16 22:40:29,957 INFO o.a.j.r.d.JsonExporter: Creating statistics for other transactions
- 2023-05-16 22:40:29,957 INFO o.a.j.r.d.JsonExporter: Checking output folder
- 2023-05-16 22:40:29,958 INFO o.a.j.r.d.JsonExporter: Writing statistics JSON to /Users/larry/Software/apache-jmeter-5.5/projects/pkslow/Reports/statistics.json
- 2023-05-16 22:40:30,006 INFO o.a.j.r.d.ReportGenerator: Exporting data using exporter:'html' of className:'org.apache.jmeter.report.dashboard.HtmlTemplateExporter'
- 2023-05-16 22:40:30,007 INFO o.a.j.r.d.HtmlTemplateExporter: Will generate dashboard in folder: /Users/larry/Software/apache-jmeter-5.5/projects/pkslow/Reports
- 2023-05-16 22:40:30,142 INFO o.a.j.r.d.HtmlTemplateExporter: Report will be generated in: /Users/larry/Software/apache-jmeter-5.5/projects/pkslow/Reports, creating folder structure
- 2023-05-16 22:40:30,145 INFO o.a.j.r.d.TemplateVisitor: Copying folder from '/Users/larry/Software/apache-jmeter-5.5/bin/report-template' to '/Users/larry/Software/apache-jmeter-5.5/projects/pkslow/Reports', got message: /Users/larry/Software/apache-jmeter-5.5/projects/pkslow/Reports, found non empty folder with following content [/Users/larry/Software/apache-jmeter-5.5/projects/pkslow/Reports/statistics.json], will be ignored
- 2023-05-16 22:40:30,472 INFO o.a.j.JMeter: Dashboard generated
Worker收到指令也会开始工作并打印一些简单的日志:
- $ /home/larry/software/apache-jmeter-5.5/bin/jmeter-server -Dserver.rmi.ssl.disable=true -Djava.rmi.server.hostname=192.168.50.171
- Created remote object: UnicastServerRef2 [liveRef: [endpoint:[192.168.50.171:44621](local),objID:[4d13369d:18824fd059a:-7fff, 2287886479123818682]]]
- Starting the test on host 192.168.50.171 @ 2023 May 16 22:37:31 HKT (1684247851980)
- Warning: Nashorn engine is planned to be removed from a future JDK release
- Finished the test on host 192.168.50.171 @ 2023 May 16 22:40:24 HKT (1684248024679)
Step 6: 结果和报告
整个测试跑完后,可以找到对应的结果:
- $ ls -l /Users/larry/Software/apache-jmeter-5.5/projects/pkslow/
- total 72
- drwxr-xr-x 6 larry staff 192 May 16 22:40 Reports
- -rw-r--r-- 1 larry staff 23472 May 16 22:40 performance-test.csv
- -rw-r--r-- 1 larry staff 10593 May 16 09:50 performance-test.jmx
在Reports目录下直接打开 index.html:
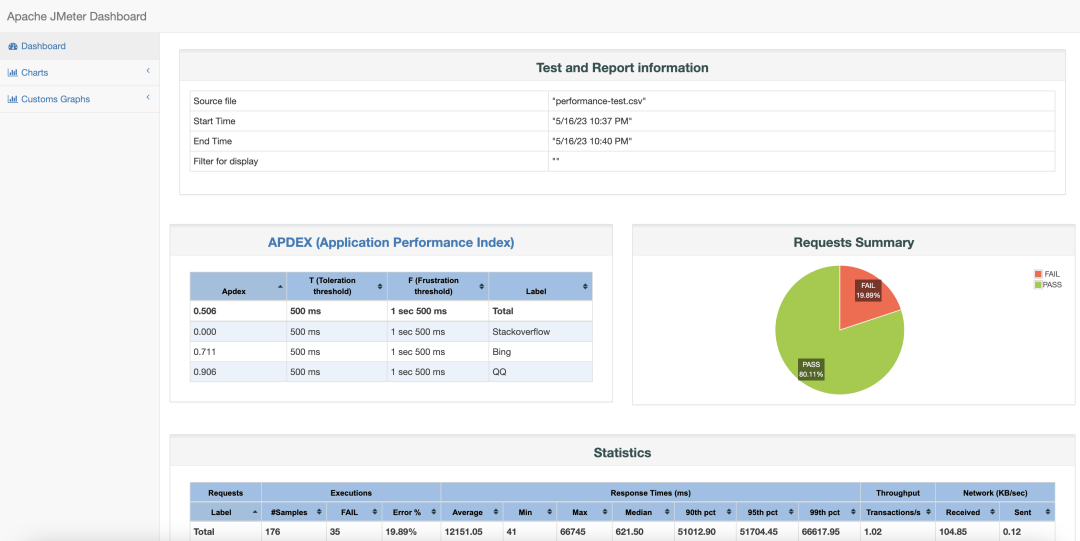
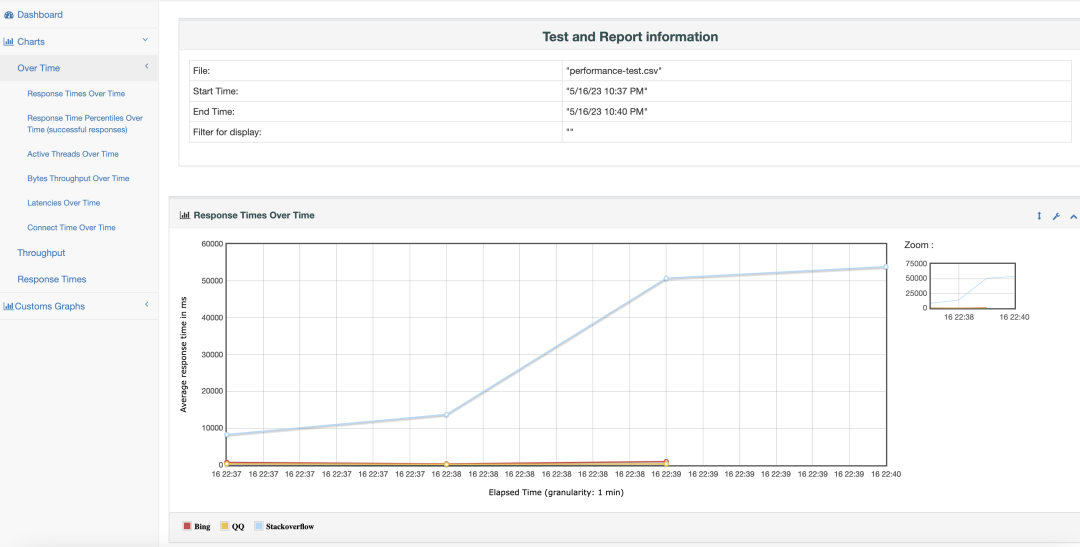
其它提示
改变Worker的端口
Worker的默认端口是1099,但它是可以改变的,有些时候也必须改变,如设置的防火墙,或者需要在同一台Server启动多个Worker。具体命令如下:
$ /home/larry/software/apache-jmeter-5.5/bin/jmeter-server -Dserver.rmi.ssl.disable=true -Djava.rmi.server.hostname=192.168.50.60 -Dserver_port=1984
当然,Controller也要同步调整自己的命令:
$ ./bin/jmeter -n -t projects/pkslow/performance-test.jmx -l projects/pkslow/performance-test.csv -e -o projects/pkslow/Reports -Dserver.rmi.ssl.disable=true -R 192.168.50.171:1984,192.168.50.60:1984
使用nohup来跑测试
性能测试有时需要跑很长时间,建议使用nohup模式来运行:
- $ nohup ./bin/jmeter -n -t projects/pkslow/performance-test.jmx -l projects/pkslow/performance-test.csv -e -o projects/pkslow/Reports -Dserver.rmi.ssl.disable=true -R 192.168.50.171:1984,192.168.50.60:1984 &
- [1] 81248
指定结果时添加时间
这样很清晰知道是什么时候开始跑的,也避免目录存在报错。
$ nohup ./bin/jmeter -n -t projects/pkslow/performance-test.jmx -l projects/pkslow/performance-test."$(date +%F.%T)".csv -e -o projects/pkslow/Reports-"$(date +%F.%T)" -Dserver.rmi.ssl.disable=true -R 192.168.50.171:1984,192.168.50.60:1984 &
不过这样也要注意定期清理不需要的结果,以免占用硬盘空间。
总结
性能测试是非常重要的,而Apache JMeter开源又好用,可以在项目中使用起来。
最后感谢每一个认真阅读我文章的人,礼尚往来总是要有的,这些资料,对于【软件测试】的朋友来说应该是最全面最完整的备战仓库,虽然不是什么很值钱的东西,如果你用得到的话可以直接拿走:
这些资料,对于【软件测试】的朋友来说应该是最全面最完整的备战仓库,这个仓库也陪伴上万个测试工程师们走过最艰难的路程,希望也能帮助到你!