
热门标签
热门文章
- 1Elasticsearch 创建、更新、删除文档、处理冲突_elasticsearchrepository更新
- 2linux/Ubuntu系统上安装mysql数据库(附图详解)
- 3FFMPEG数据结构_ffopgtg
- 4AssertionError: Torch not compiled with CUDA enabled【pycharm/python3/pip】
- 5Docker Compose 命令详解_dockercompose命令详解
- 6adb常用命令总结_adb shell dumpsys activity
- 7Git进阶:修改上次提交 git commit --amend_git amend修改再次提交
- 8a标签下载功能(同域和跨域)_a标签跨域下载
- 9STM32CubeMX(5)—— STM32利用PWM控制42步进电机_pwm四路输出控制步进电机正反转
- 10STM32 PWM实现呼吸灯_stm32点呼吸灯
当前位置: article > 正文
vue的echarts学习(折线图line,柱状图bar)_avue 2.9.2版本 柱状图avue-echart-bar使用
作者:AI算法诗人 | 2024-01-29 14:18:27
赞
踩
avue 2.9.2版本 柱状图avue-echart-bar使用
末尾有vue的echarts组件
line折线图
- echarts自适应页面
    let myChart = echarts.init(document.getElementById(`${this.id}`));
    myChart.clear();
    myChart.setOption(option, true);
    window.addEventListener("resize", () => {
        myChart.resize();
    });
- 1
- 2
- 3
- 4
- 5
- 6


- 提示+吸附
   let option = {
       tooltip: {
           trigger: "axis",
           axisPointer: {
               snap: true,
           },
       },
   }
- 1
- 2
- 3
- 4
- 5
- 6
- 7
- 8
- 流线型+放大数据点+渐变背景
let option = {
    series: [
         {
         name: "浏览次数",
         data: [820, 932, 901, 934, 1290, 1330, 1320],
         type: "line",
         smooth: true,//流线型
         symbolSize: 10,//放大点
         areaStyle: {//渐变背景
             color: new echarts.graphic.LinearGradient(
                 0,
                 0,
                 0,
                 1,
                 [
                     {
                         offset: 0,
                         color: "#66CCCC",
                     },
                     {
                         offset: 1,
                         color: "#fff",
                     },
                 ]
             ),
         },
     },
    ]
}

- 1
- 2
- 3
- 4
- 5
- 6
- 7
- 8
- 9
- 10
- 11
- 12
- 13
- 14
- 15
- 16
- 17
- 18
- 19
- 20
- 21
- 22
- 23
- 24
- 25
- 26
- 27
- 28
- 29
- 折线图组件(需要传id),可以自己传别的数据进行修改自定义
<template>
    <div class="table-echarts">
        <div :id="id" style="width:100%;height:100%;"></div>
    </div>
</template>

<script>
import echarts from "echarts";
export default {
    name: "table-echarts",
    props: {
        id: {
            type: String,
            default: "echarts",
        },
    },
    data() {
        return {};
    },
    watch: {},
    mounted() {
        this.initEcharts();
    },
    methods: {
        initEcharts() {
            let xAxisData = [
                "2020-9-23",
                "2020-9-24",
                "2020-9-25",
                "2020-9-26",
                "2020-9-27",
                "2020-9-28",
                "2020-9-28",
            ];
            let colors = [
                "#66CCCC",
                "#CCFF66",
                "#FF99CC",
                "#FF9999",
                "#FFFF66",
                "#FFCC00",
                "#FF9900",
                "#CC3399",
                "#CCFF99",
            ];
            let option = {
                color: colors,
                tooltip: {
                    trigger: "axis",
                    axisPointer: {
                        snap: true,
                    },
                },
                legend: {
                    data: ["浏览次数", "访问次数", "表单提交量"],
                    itemGap: 20,
                    left: "0%",
                },
                xAxis: {
                    type: "category",
                    boundaryGap: false,
                    data: xAxisData,
                },
                yAxis: {
                    type: "value",
                },
                series: [
                    {
                        name: "浏览次数",
                        data: [820, 932, 901, 934, 1290, 1330, 1320],
                        type: "line",
                        smooth: true,
                        symbolSize: 10,
                        areaStyle: {
                            color: new echarts.graphic.LinearGradient(
                                0,
                                0,
                                0,
                                1,
                                [
                                    {
                                        offset: 0,
                                        color: "#66CCCC",
                                    },
                                    {
                                        offset: 1,
                                        color: "#fff",
                                    },
                                ]
                            ),
                        },
                    },
                    {
                        name: "访问次数",
                        data: [120, 222, 401, 234, 3290, 430, 820],
                        type: "line",
                        smooth: true,
                        symbolSize: 10,
                        areaStyle: {
                            color: new echarts.graphic.LinearGradient(
                                0,
                                0,
                                0,
                                1,
                                [
                                    {
                                        offset: 0,
                                        color: "#CCFF66",
                                    },
                                    {
                                        offset: 1,
                                        color: "#fff",
                                    },
                                ]
                            ),
                        },
                    },
                    {
                        name: "表单提交量",
                        data: [1120, 322, 101, 534, 890, 230, 520],
                        type: "line",
                        smooth: true,
                        symbolSize: 10,
                        areaStyle: {
                            color: new echarts.graphic.LinearGradient(
                                0,
                                0,
                                0,
                                1,
                                [
                                    {
                                        offset: 0,
                                        color: "#FF99CC",
                                    },
                                    {
                                        offset: 1,
                                        color: "#fff",
                                    },
                                ]
                            ),
                        },
                    },
                ],
            };
            let myChart = echarts.init(document.getElementById(`${this.id}`));
            myChart.clear();
            myChart.setOption(option, true);
            window.addEventListener("resize", () => {
                myChart.resize();
            });
        },
    },
};
</script>

<style lang='less' scoped>
.table-echarts {
    width: 100%;
    height: 436px;
}
</style>
- 1
- 2
- 3
- 4
- 5
- 6
- 7
- 8
- 9
- 10
- 11
- 12
- 13
- 14
- 15
- 16
- 17
- 18
- 19
- 20
- 21
- 22
- 23
- 24
- 25
- 26
- 27
- 28
- 29
- 30
- 31
- 32
- 33
- 34
- 35
- 36
- 37
- 38
- 39
- 40
- 41
- 42
- 43
- 44
- 45
- 46
- 47
- 48
- 49
- 50
- 51
- 52
- 53
- 54
- 55
- 56
- 57
- 58
- 59
- 60
- 61
- 62
- 63
- 64
- 65
- 66
- 67
- 68
- 69
- 70
- 71
- 72
- 73
- 74
- 75
- 76
- 77
- 78
- 79
- 80
- 81
- 82
- 83
- 84
- 85
- 86
- 87
- 88
- 89
- 90
- 91
- 92
- 93
- 94
- 95
- 96
- 97
- 98
- 99
- 100
- 101
- 102
- 103
- 104
- 105
- 106
- 107
- 108
- 109
- 110
- 111
- 112
- 113
- 114
- 115
- 116
- 117
- 118
- 119
- 120
- 121
- 122
- 123
- 124
- 125
- 126
- 127
- 128
- 129
- 130
- 131
- 132
- 133
- 134
- 135
- 136
- 137
- 138
- 139
- 140
- 141
- 142
- 143
- 144
- 145
- 146
- 147
- 148
- 149
- 150
- 151
- 152
- 153
- 154
- 155
- 156
- 157
- 158
- 159
- 160
- 161
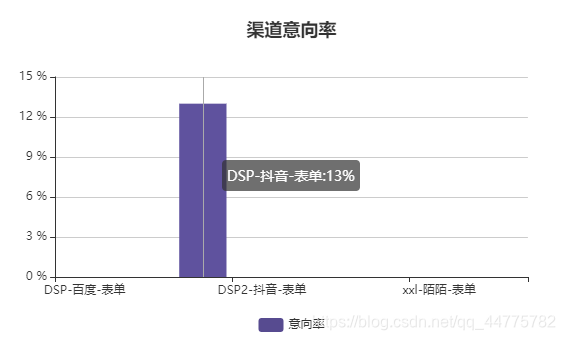
bar柱状图
最终样式
- 自适应和上面一样
- 提示和吸附
提示注意我这里是百分比,所以需要处理。简单的可以用
formatter。
关于formatter,详细可看formatter
模板变量有 {a}, {b},{c},{d},{e},分别表示系列名,数据名,数据值等。
 tooltip: {
     trigger: "axis",
     axisPointer: {
         snap: true,
     },
     formatter: "{b}:{c}%",
 },
- 1
- 2
- 3
- 4
- 5
- 6
- 7
复杂的提示需要用回调函数处理。
tooltip: {
    trigger: "axis",
    formatter: function (params, ticket, callback) {
        return `<p>${}</p>${}`;
    }
},
- 1
- 2
- 3
- 4
- 5
- 6

y轴的百分数也要处理。
- y轴需要传不含%的数字或者字符串,[1,2,3…]
- 对y轴处理
 yAxis: {
     type: "value",
     axisLabel: {
         formatter: "{value} %",
     },
 },
- 1
- 2
- 3
- 4
- 5
- 6
- 组件
- 需要传个对象,channelData是个对象,里面有x轴数据
xAxisData,y轴数据seriesDatas
<template>
    <div class="echarts-contanier">
        <div id="channel-echarts" style="width:100%;height:100%;"></div>
    </div>
</template>

<script>
import echarts from "echarts";
export default {
    props: {
        channelData: {
            type: Object,
            default: {},
        },
    },
    name: "",
    data() {
        return {};
    },
    watch: {
        channelData: {
            handler(val) {
                this.initEcharts();
            },
            deep: true,
        },
    },
    mounted() {
        this.initEcharts();
    },
    methods: {
        initEcharts() {
            let option = {
                color: "#574b90",
                title: {
                    left: "center",
                    text: "渠道意向率",
                },
                tooltip: {
                    trigger: "axis",
                    axisPointer: {
                        snap: true,
                    },
                    formatter: "{b}:{c}%",
                },
                legend: {
                    data: ["意向率"],
                    bottom: "0%",
                },
                xAxis: {
                    type: "category",
                    data: this.channelData.xAxisData,
                },
                yAxis: {
                    type: "value",
                    axisLabel: {
                        formatter: "{value} %",
                    },
                },
                series: [
                    {
                        name: "意向率",
                        data: this.channelData.seriesDatas,
                        type: "bar",
                        areaStyle: {},
                    },
                ],
            };
            let myChart = echarts.init(
                document.getElementById(`channel-echarts`)
            );
            myChart.clear();
            myChart.setOption(option, true);
            window.addEventListener("resize", () => {
                myChart.resize();
            });
        },
    },
};
</script>

<style lang='less' scoped>
.echarts-contanier {
    width: 100%;
    height: 100%;
}
</style>
- 1
- 2
- 3
- 4
- 5
- 6
- 7
- 8
- 9
- 10
- 11
- 12
- 13
- 14
- 15
- 16
- 17
- 18
- 19
- 20
- 21
- 22
- 23
- 24
- 25
- 26
- 27
- 28
- 29
- 30
- 31
- 32
- 33
- 34
- 35
- 36
- 37
- 38
- 39
- 40
- 41
- 42
- 43
- 44
- 45
- 46
- 47
- 48
- 49
- 50
- 51
- 52
- 53
- 54
- 55
- 56
- 57
- 58
- 59
- 60
- 61
- 62
- 63
- 64
- 65
- 66
- 67
- 68
- 69
- 70
- 71
- 72
- 73
- 74
- 75
- 76
- 77
- 78
- 79
- 80
- 81
- 82
- 83
- 84
- 85
- 86
- 87
本文内容由网友自发贡献,转载请注明出处:https://www.wpsshop.cn/article/detail/43208
推荐阅读
cn.hutool ...赞
踩

相关标签

