
热门标签
热门文章
- 1初识云计算
- 2traceroute命令结果分析_traceroute命令详解
- 32021-10-30_使用vmware软件启动提供的opensatckallinone镜像,自行检查openstack中各
- 4《Redis核心技术与实战》学习笔记1——基本架构:一个键值数据库包含什么?
- 5java list取最后一个元素_Java stream() 获取List指定元素或最后一个元素的方法
- 6Vite+Vue3+TypeScript_vite vue3 typescript
- 7NFC 学习笔记 5 MFRC522读写器2 NDEF_nfc data exchange format
- 8接口开放平台的产品设计脑图及解决方案_api开放平台设计文档
- 9【小白学OpenCV】(1): 图像处理之低通滤波_低通滤波器实现图像信号的滤波运算
- 10Docker和docker-compose基础入门及应用部署_docker部署和dockercompose
当前位置: article > 正文
AntV-G6手动添加节点和边,实现拓扑图的可视化展示_antvg6 拓扑图
作者:代码独立开发者 | 2024-01-29 14:17:56
赞
踩
antvg6 拓扑图
一小时实现简单的手动添加节点和边,实现可视化展示
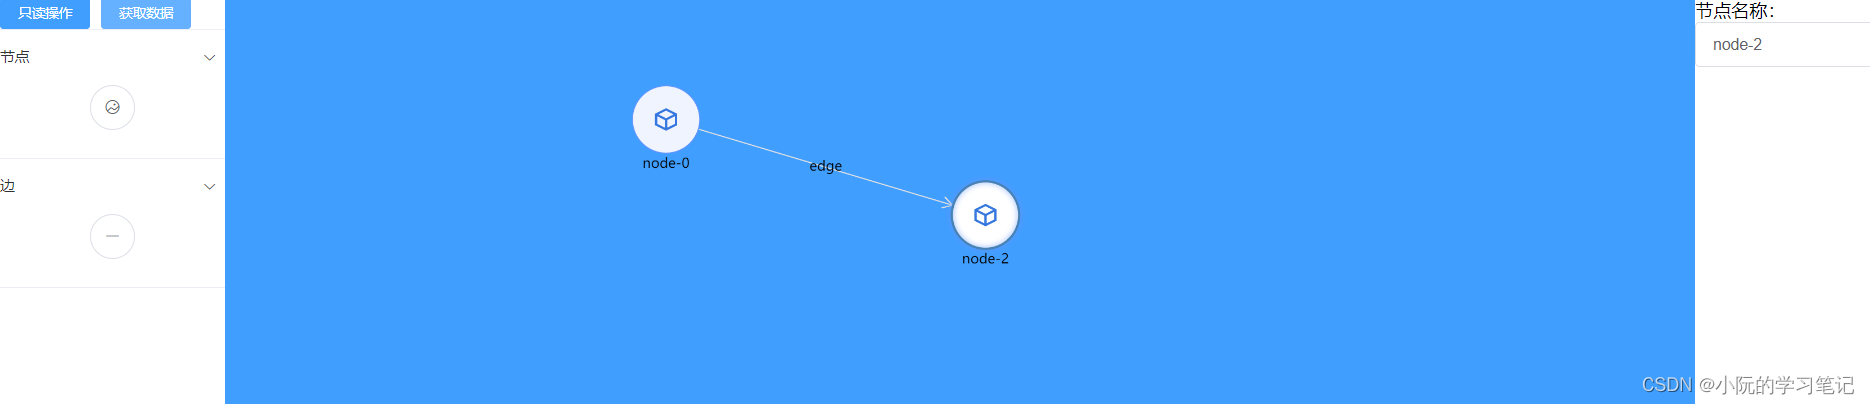
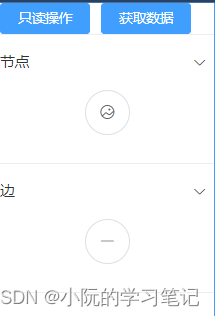
左边:取消添加节点和边、获取的拓扑图数据、添加节点、添加边
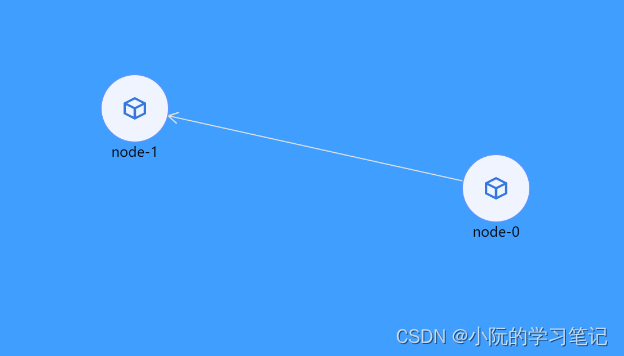
中间:可视化展示区域
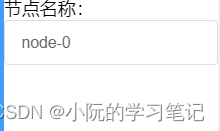
右边:修改节点信息、修改边信息
下面是一些关键代码
根据官网修改G6设置交互模式
添加节点
注册自定义事件:G6.registerBehavior
    /**
     * @description 注册点击添加节点
     */
    addNode() {
      let _this = this;
      G6.registerBehavior("click-add-node", {
        // Set the events and the corresponding responsing function for this behavior
        getEvents() {
          // The event is canvas:click, the responsing function is onClick
          return {
            "canvas:click": "onClick",
          };
        },
        // Click event
        onClick(ev) {
          const self = this;
          const graph = self.graph;
          // Add a new node
          graph.addItem("node", {
            x: ev.canvasX,
            y: ev.canvasY,
            id: `node-${_this.addedCount}`, // Generate the unique id
            label: `node-${_this.addedCount}`,
          });
          _this.addedCount++;
        },
      });
    },

- 1
- 2
- 3
- 4
- 5
- 6
- 7
- 8
- 9
- 10
- 11
- 12
- 13
- 14
- 15
- 16
- 17
- 18
- 19
- 20
- 21
- 22
- 23
- 24
- 25
- 26
- 27
- 28
添加边
注册自定义事件:G6.registerBehavior
    /**
     * @description 注册点击添加边
     */
    addEdge() {
      G6.registerBehavior("click-add-edge", {
        // Set the events and the corresponding responsing function for this behavior
        getEvents() {
          return {
            "node:click": "onClick", // The event is canvas:click, the responsing function is onClick
            mousemove: "onMousemove", // The event is mousemove, the responsing function is onMousemove
            "edge:click": "onEdgeClick", // The event is edge:click, the responsing function is onEdgeClick
          };
        },
        // The responsing function for node:click defined in getEvents
        onClick(ev) {
          const self = this;
          const node = ev.item;
          const graph = self.graph;
          // The position where the mouse clicks
          // const point = { x: ev.x, y: ev.y };
          const model = node.getModel();
          if (self.addingEdge && self.edge) {
            graph.updateItem(self.edge, {
              target: model.id,
            });

            self.edge = null;
            self.addingEdge = false;
          } else {
            // Add anew edge, the end node is the current node user clicks
            self.edge = graph.addItem("edge", {
              source: model.id,
              target: model.id,
            });
            self.addingEdge = true;
          }
        },
        // The responsing function for mousemove defined in getEvents
        onMousemove(ev) {
          const self = this;
          // The current position the mouse clicks
          const point = { x: ev.x, y: ev.y };
          if (self.addingEdge && self.edge) {
            // Update the end node to the current node the mouse clicks
            self.graph.updateItem(self.edge, {
              target: point,
            });
          }
        },
        // The responsing function for edge:click defined in getEvents
        onEdgeClick(ev) {
          const self = this;
          const currentEdge = ev.item;
          if (self.addingEdge && self.edge === currentEdge) {
            self.graph.removeItem(self.edge);
            self.edge = null;
            self.addingEdge = false;
          }
        },
      });
    },
- 1
- 2
- 3
- 4
- 5
- 6
- 7
- 8
- 9
- 10
- 11
- 12
- 13
- 14
- 15
- 16
- 17
- 18
- 19
- 20
- 21
- 22
- 23
- 24
- 25
- 26
- 27
- 28
- 29
- 30
- 31
- 32
- 33
- 34
- 35
- 36
- 37
- 38
- 39
- 40
- 41
- 42
- 43
- 44
- 45
- 46
- 47
- 48
- 49
- 50
- 51
- 52
- 53
- 54
- 55
- 56
- 57
- 58
- 59
- 60
- 61
点击节点,获取当前节点数据并进行修改
// 注册事件
graph.on("node:click", this.onNodeClick);
// 获取数据
onNodeClick(e) {
  this.mode = "node";
  const item = e.item.getModel();
  this.nodeData.label = item.label;
  this.nodeData.id = item.id;
}
// 修改数据
changeNodeName() {
  if (this.nodeData.id) {
    const item = graph.findById(this.nodeData.id);
    graph.updateItem(item, {
      label: this.nodeData.label,
    });
  }
}
- 1
- 2
- 3
- 4
- 5
- 6
- 7
- 8
- 9
- 10
- 11
- 12
- 13
- 14
- 15
- 16
- 17
- 18
点击边,获取当前边数据并进行修改
// 注册事件
graph.on("edge:click", this.onEdgeClick);
// 获取数据
onEdgeClick(e) {
  this.mode = "edge";
  const item = e.item.getModel();
  this.edgeData.label = item.label;
  this.edgeData.id = item.id;
}
// 修改数据
changeEdgeName() {
  if (this.edgeData.id) {
    const item = graph.findById(this.edgeData.id);
    graph.updateItem(item, {
      label: this.edgeData.label,
    });
  }
}
- 1
- 2
- 3
- 4
- 5
- 6
- 7
- 8
- 9
- 10
- 11
- 12
- 13
- 14
- 15
- 16
- 17
- 18
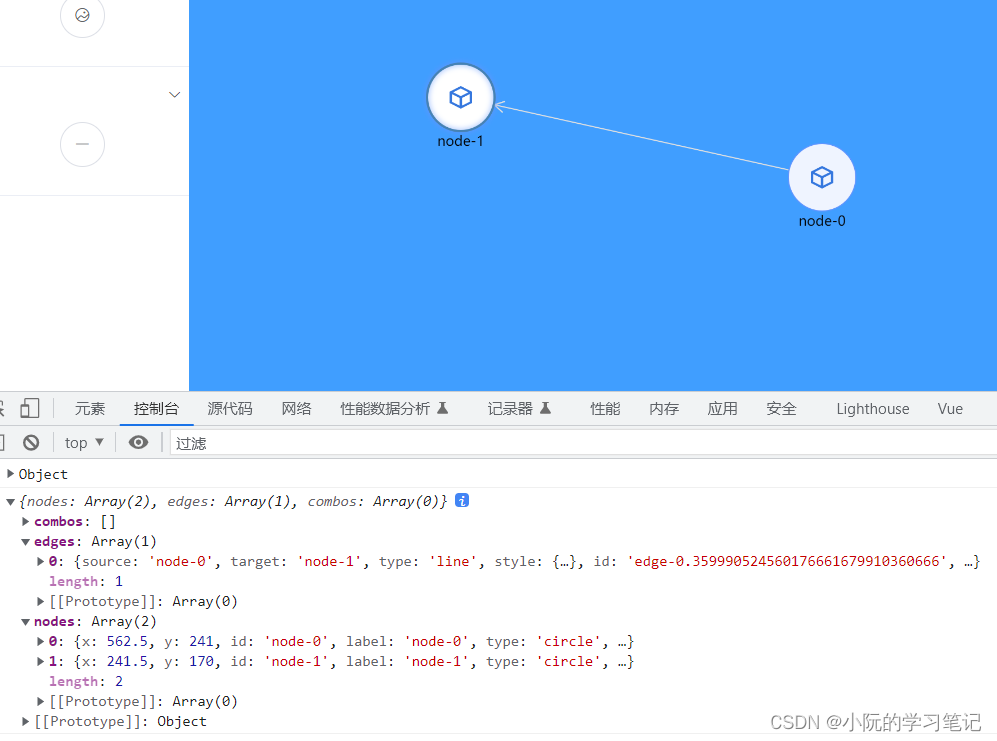
获取当前拓扑图的数据
getData() {
  console.log(graph.save());
}
- 1
- 2
- 3
非常简单的demo,仓库地址
想要更多的自定义的节点和边,可以看该仓库下的另一个页面,或者G6官网
声明:本文内容由网友自发贡献,不代表【wpsshop博客】立场,版权归原作者所有,本站不承担相应法律责任。如您发现有侵权的内容,请联系我们。转载请注明出处:https://www.wpsshop.cn/article/detail/43207
推荐阅读
相关标签

