
热门标签
热门文章
- 1mujoco环境安装问题_mujoco安装
- 2大一学生数据结构与算法的先后取舍_acm先学数据结构还是算法
- 3深度学习论文阅读路线图
- 4# hadoop入门第六篇-Hive实例_describle table语句
- 5Flink(四) 状态管理 1_flink 状态管理
- 6从零开始开发微信小程序:全面指南_微信小程序开发指南
- 7一篇文章玩转GDB/LLDB调试Redis源码_lldb 调试 redis
- 8(四)快速图像风格迁移训练模型载入及处理图像_快速风格迁移模型训练
- 9【2024版】超详细Python+Pycharm安装保姆级教程,Python+Pycharm环境配置和使用指南,看完这一篇就够了_安装python和pycharm
- 10大模型越狱攻击框架:集成11种方法,揭示大模型参数量和安全性的新规律
当前位置: article > 正文
vue 实现 【echarts中综合图表图例】的组件封装及调用_vue 图表插件
作者:黑客灵魂 | 2024-07-30 15:32:30
赞
踩
vue 图表插件
echarts组件使用参考:https://blog.csdn.net/weixin_50450473/article/details/121510438
目录
图例一:
图例二:
图例三:
图例四:
图例五:
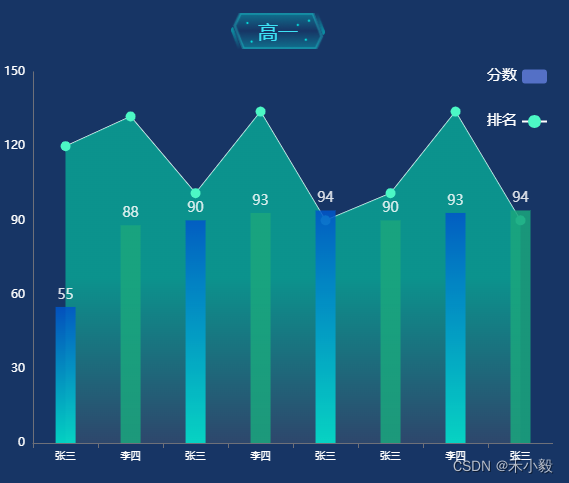
图例一
- let yData = ["张三", "李四", "张三", "李四", "张三", "张三", "李四", "张三"];
- let surplus = [55, 88, 90, 93, 94, 90, 93, 94];
- option = {
- backgroundColor:'#173565',
- legend: {
- data: ['分数', '排名'],
- x: 'right',
- y: '0%',
- itemGap: 30,
- orient: 'vertical',
- textStyle:{
- color: '#fff',
- fontSize: 15
- }
- },
- grid: {
- top: '2%',
- left: '0%',
- right: '0%',
- bottom: '0%',
- containLabel: true
- },
- xAxis: {
- type: 'category',
- data: yData,
- axisLabel: {
- fontSize: 10,
- color: '#fff'
- }
- },
- yAxis: {
- type: 'value',
- boundaryGap: true,
- axisLabel: {
- fontSize: 12,
- color: '#fff'
- },
- interval: 20, //间隔
- axisLine: {
- show: true
- },
- splitLine: {
- show: false
- }
- },
- series: [
- {
- name:'分数',
- data: surplus,
- type: 'bar',
- zlevel: 1, // 层级
- barWidth: 20,
- itemStyle: {
- color: function (params) {
- var colorList1 = ['#00EAD1', '#1AA67D','#00EAD1', '#1AA67D','#00EAD1', '#1AA67D','#00EAD1', '#1AA67D','#00EAD1', '#1AA67D'];
- var colorList2 = ['#0055CB', '#1AA67D','#0055CB', '#1AA67D','#0055CB', '#1AA67D','#0055CB', '#1AA67D','#0055CB', '#1AA67D'];
- return new echarts.graphic.LinearGradient(0, 0, 0, 1, [
- { offset: 0, color: colorList2[params.dataIndex] },
- { offset: 1, color: colorList1[params.dataIndex] }
- ])
- }
- },
- label: {
- normal: {
- position: 'top',
- show: true,
- color: '#fff',
- fontSize: 14,
- formatter: function (params) {
- return params.data
- }
- }
- }
- },
- {
- name: '排名',
- type: 'line',
- zlevel: 0, // 层级
- symbol: 'circle', //拐点样式
- symbolSize: 6, //拐点大小
- // 折线条的样式
- lineStyle: {
- color: '#fff',
- width: 1
- },
- // 折线拐点的样式
- itemStyle: {
- normal: { // 静止时:
- color: '#4CF8C5',
- borderColor: "#4CF8C5",//拐点的边框颜色
- borderWidth: 4
- },
- emphasis: { // 鼠标经过时:
- color: '#4CF8C5',
- }
- },
- areaStyle: {
- color: new echarts.graphic.LinearGradient(0, .5, 0, 1, [
- {
- offset: 0,
- color: '#06B89C'
- },
- {
- offset: 1,
- color: '#374D6E'
- }
- ])
- },
- emphasis: {
- focus: 'series'
- },
- data: [120, 132, 101, 134, 90, 101, 134, 90]
- }
- ]
- }
图例二
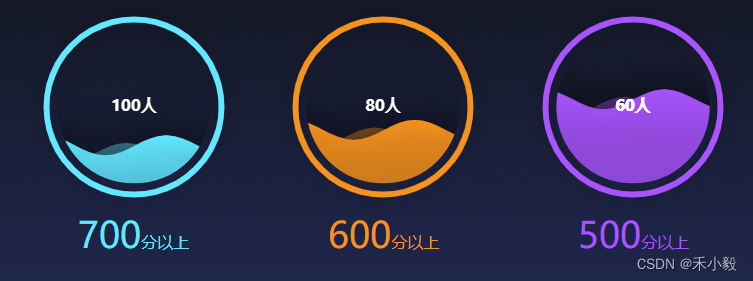
1、安装插件
水波纹参考地址:echarts-liquidfill - npm
坑:版本不对导致水波纹不法显示
解决:其中 echarts 版本5以上 和 echarts-liquidfill 版本3对应,echarts 版本5以下 和 echarts-liquidfill 版本2对应;此处 echarts@4.9.0 和 echarts-liquidfill@2.0.6 即可
- npm install echarts@4.9.0 --save
- npm install echarts-liquidfill@2.0.6 --save
2、页面引入
import 'echarts-liquidfill'3、option.js
- let progress = 50;
- let Colors = '71, 228, 229';
- let proNum = 100;
- option = {
- series: [
- {
- type: 'liquidFill',
- waveAnimation: 15,
- amplitude: 10,
- data: [progress, progress + 0.05, progress + 0.05],
- color: [
- {
- type: 'linear',
- x: 0,
- y: 1,
- x2: 0,
- y2: 0,
- colorStops: [
- {
- offset: 1,
- color: ['rgba(' + Colors + ',0.58)']
- },
- {
- offset: 0,
- color: ['rgba(' + Colors + ',0.2)']
- }
- ],
- global: false
- },
- {
- type: 'linear',
- x: 0,
- y: 1,
- x2: 0,
- y2: 0,
- colorStops: [
- {
- offset: 1,
- color: ['rgba(' + Colors + ',1)']
- },
- {
- offset: 0,
- color: ['rgba(' + Colors + ',0.8)']
- }
- ],
- global: false
- },
- {
- type: 'linear',
- x: 0,
- y: 1,
- x2: 0,
- y2: 0,
- colorStops: [
- {
- offset: 1,
- color: ['rgba(' + Colors + ',1)']
- },
- {
- offset: 0,
- color: ['rgba(' + Colors + ',0)']
- }
- ],
- global: false
- }
- ],
- radius: '85%',
- outline: {
- itemStyle: {
- borderWidth: 6,
- borderColor: 'rgba(' + Colors + ',1)'
- }
- // borderDistance: 0 // 取消缝隙
- },
- itemStyle: {
- opacity: 0.8, // 波浪的透明度
- shadowBlur: 0 // 波浪的阴影范围 设置为0不会出现底色为灰色的情况
- },
- label: {
- normal: {
- // insideColor: 'transparent', // 固定的文字颜色
- formatter: '\n'+'+proNum + '人', // 换行,设置位置
- fontSize: 16,
- color: '#fff'
- }
- },
- backgroundStyle: {
- color: 'transparent' // 水球未到的背景颜色
- }
- }
- ]
- };
图例三
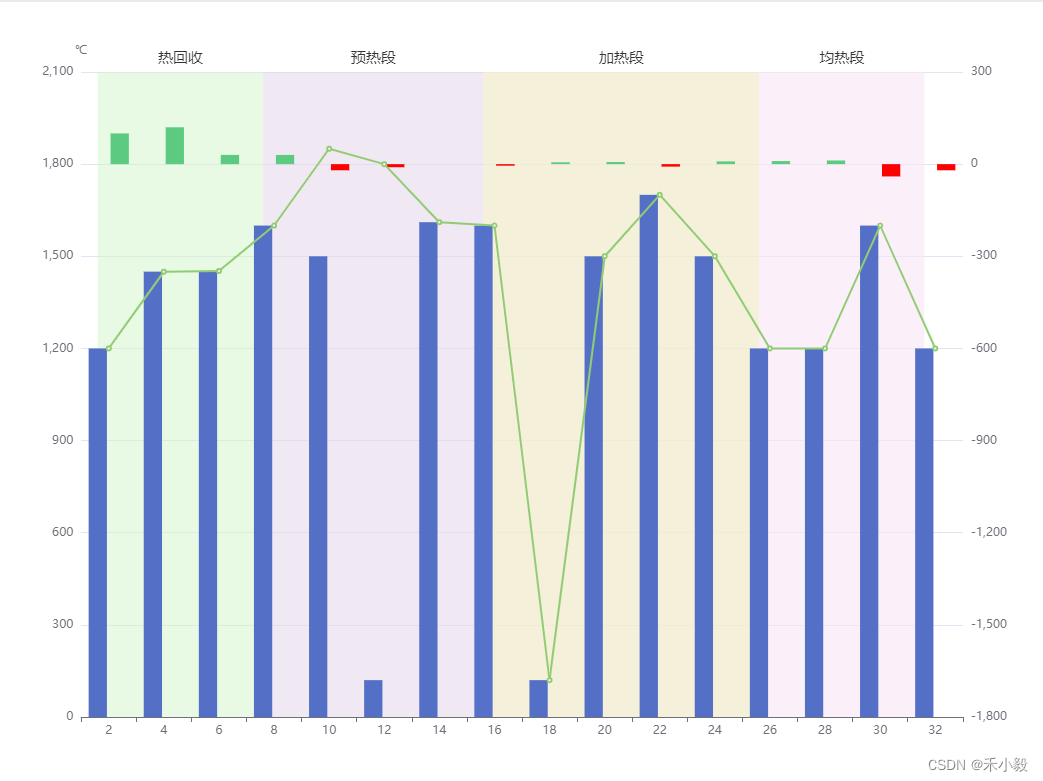
- option = {
- xAxis: {
- type: 'category',
- data: [2, 4, 6, 8, 10, 12, 14, 16, 18, 20, 22, 24, 26, 28, 30, 32]
- // boundaryGap: false,
- },
- yAxis: [
- {
- type: 'value',
- name: '℃',
- splitLine: {
- show: true
- }
- },
- {
- type: 'value',
- min: -1800,
- axisLabel: {
- show: true
- }
- }
- ],
- series: [
- {
- data: [
- 1200, 1450, 1452, 1600, 1500, 120, 1611, 1600, 120, 1500, 1700, 1500,
- 1200, 1200, 1600, 1200
- ],
- type: 'bar',
- stack: 'Total',
- markArea: {
- label: {
- color: '#333',
- fontSize: 15
- },
- data: [
- [
- {
- name: '热回收',
- xAxis: 0,
- itemStyle: {
- color: 'rgba(210,243,202,.5)'
- }
- },
- {
- xAxis: 3.4
- }
- ],
- [
- {
- name: '预热段',
- xAxis: 3.4,
- itemStyle: {
- color: 'rgba(226,212,233,.5)'
- }
- },
- {
- xAxis: 7
- }
- ],
- [
- {
- name: '加热段',
- xAxis: 7,
- itemStyle: {
- color: 'rgba(243,236,208,.8)'
- }
- },
- {
- xAxis: 12
- }
- ],
- [
- {
- name: '均热段',
- xAxis: 12,
- itemStyle: {
- color: 'rgba(249,230,245,.6)'
- }
- },
- {
- xAxis: 18
- }
- ]
- ]
- }
- },
- {
- name: 'Temperature',
- type: 'line',
- data: [
- 1200, 1450, 1452, 1600, 1850, 1800, 1611, 1600, 120, 1500, 1700, 1500,
- 1200, 1200, 1600, 1200
- ]
- },
- {
- name: '',
- type: 'bar',
- yAxisIndex: 1,
- itemStyle: {
- color: function (params) {
- var colorList;
- if (params.data >= 0) {
- colorList = '#5ccb81';
- } else {
- colorList = 'red';
- }
- return colorList;
- }
- },
- data: [100, 120, 30, 30, -20, -10, 0, -5, 6, 7, -8, 9, 10, 12, -40, -20]
- }
- ]
- };
图例四
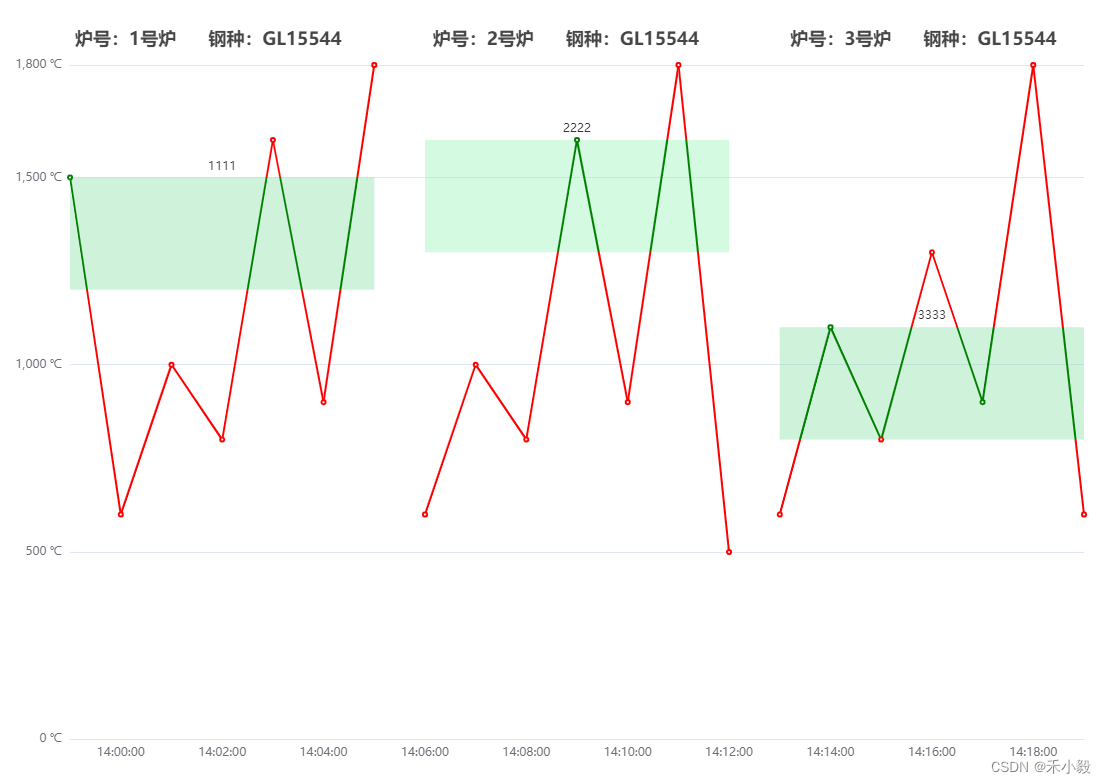
- const dataList=[
- {
- heatNum:'1',
- steelGrade:'GL15544',
- datas: [
- [0,1500],
- [50,600],
- [100,1000],
- [150,800],
- [200,1600],
- [250,900],
- [300,1800]
- ]
- },
- {
- heatNum:'2',
- steelGrade:'GL15544',
- datas: [
- [350,600],
- [400,1000],
- [450,800],
- [500,1600],
- [550,900],
- [600,1800],
- [650,500]
- ]
- },
- {
- heatNum:'3',
- steelGrade:'GL15544',
- datas: [
- [700,600],
- [750,1100],
- [800,800],
- [850,1300],
- [900,900],
- [950,1800],
- [1000,600]
- ]
- }
- ]
- option = {
- title:{
- text: '炉号:'+dataList[0].heatNum+'号炉 钢种:'+dataList[0].steelGrade
- +' 炉号:'+dataList[1].heatNum+'号炉 钢种:'+dataList[1].steelGrade
- +' 炉号:'+dataList[2].heatNum+'号炉 钢种:'+dataList[2].steelGrade,
- left:'6%',
- top:'3%'
- },
- grid:{
- top:'8%',
- left:'6%',
- right:'2%',
- bottom:'5%'
- },
- xAxis:[
- {
- type: 'value',
- show: false,
- max: 1000,
- position:'top'
- },
- {
- type: 'category',
- data: ['14:00:00','14:02:00', '14:04:00', '14:06:00', '14:08:00', '14:10:00',
- '14:12:00', '14:14:00', '14:16:00','14:18:00'],
- axisLine:{
- show:false
- },
- axisTick:{
- show:false
- }
- },
- ],
- yAxis: {
- type: 'value',
- max:1800,
- min:0,
- splitNumber:4,
- axisLabel: {
- formatter: '{value} ℃'
- },
- axisLine:{
- show:false
- },
- axisTick:{
- show:false
- }
- },
- visualMap:[
- {
- show:false,
- splitNumber:3,
- seriesIndex:0, // 指第几个图形
- pieces:[
- {
- gte:0,
- lte:1200,
- color:'red'
- },
- {
- gte:1200,
- lte:1500,
- color:'green'
- },
- {
- gte:1500,
- lte:1800,
- color:'red'
- }
- ]
- },
- {
- show:false,
- splitNumber:3,
- seriesIndex:1,
- pieces:[
- {
- gte:0,
- lte:1300,
- color:'red'
- },
- {
- gte:1300,
- lte:1600,
- color:'green'
- },
- {
- gte:1600,
- lte:1800,
- color:'red'
- }
- ]
- },
- {
- show:false,
- splitNumber:3,
- seriesIndex:2,
- pieces:[
- {
- gte:0,
- lte:800,
- color:'red'
- },
- {
- gte:800,
- lte:1100,
- color:'green'
- },
- {
- gte:1100,
- lte:1800,
- color:'red'
- }
- ]
- }
- ],
- series: [
- {
- type: 'line',
- smooth:false,
- data: [
- [0,1500],
- [50,600],
- [100,1000],
- [150,800],
- [200,1600],
- [250,900],
- [300,1800]
- ],
- markArea:{
- itemStyle:{
- color:'rgba(134,222,165,.4)'
- },
- data:[
- [{
- name:'1111',
- yAxis:1200,
- xAxis:0
- },{
- yAxis:1500,
- xAxis:300
- }]
- ]
- }
- },
- {
- type: 'line',
- smooth:false,
- data: [
- [350,600],
- [400,1000],
- [450,800],
- [500,1600],
- [550,900],
- [600,1800],
- [650,500]
- ],
- markArea:{
- itemStyle:{
- color:'rgba(134,222,165,.4)'
- },
- data:[
- [{
- name:'2222',
- yAxis:1300,
- xAxis:350
- },{
- yAxis:1600,
- xAxis:650
- }]
- ]
- }
- },
- {
- type: 'line',
- smooth:false,
- data: [
- [700,600],
- [750,1100],
- [800,800],
- [850,1300],
- [900,900],
- [950,1800],
- [1000,600]
- ],
- markArea:{
- itemStyle:{
- color:'rgba(134,222,165,.4)'
- },
- data:[
- [{
- name:'3333',
- yAxis:800,
- xAxis:700
- },{
- yAxis:1100,
- xAxis:1000
- }]
- ]
- }
- }
- ]
- };
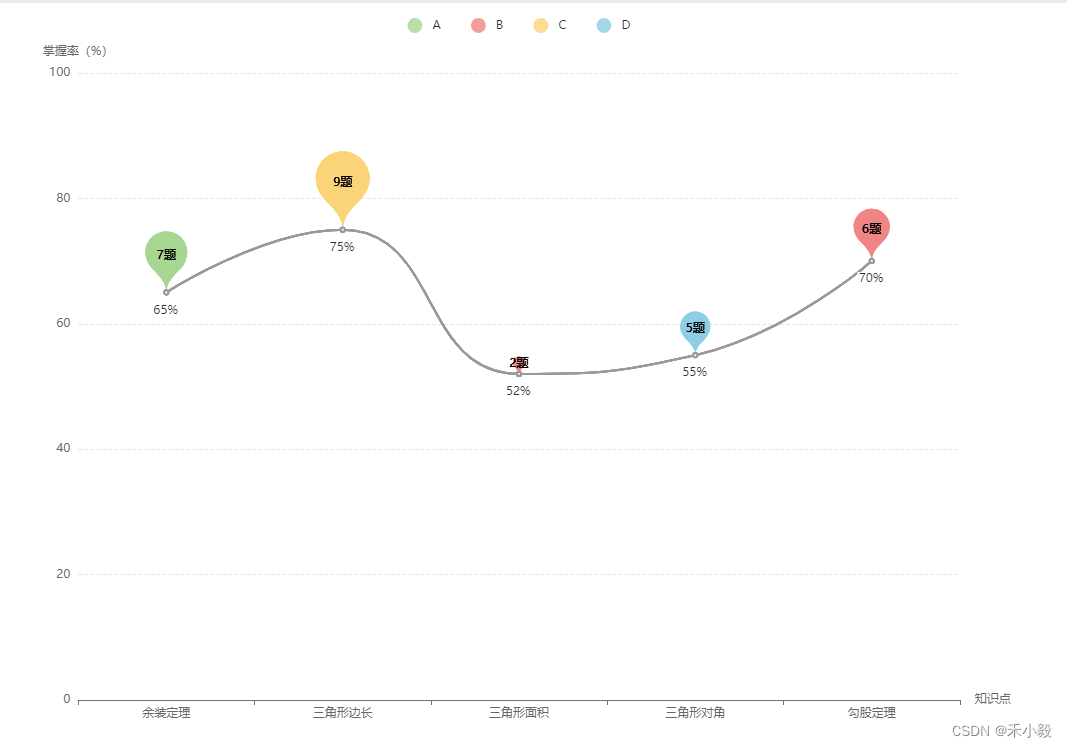
图例五
- let datas = [
- { name: '余装定理', diffic: 'D', master: 65, num: 7 },
- { name: '三角形边长', diffic: 'B', master: 75, num: 9 },
- { name: '三角形面积', diffic: 'A', master: 52, num: 2 },
- { name: '三角形对角', diffic: 'C', master: 55, num: 5 },
- { name: '勾股定理', diffic: 'A', master: 70, num: 6 }
- ];
- const colorList = ['#a7d691', '#f18585', '#fbd379', '#8fcde5'];
- let className = ['A', 'B', 'C', 'D'];
- let xName = [];
- let series = [];
- datas.forEach((da) => {
- xName.push([da.name, da.master, da.diffic, da.num]);
- });
- className.forEach((cl) => {
- series.push(
- {
- type: 'line',
- smooth: true,
- data: datas.map((m) => {
- return m.master;
- }),
- color: '#999',
- label: {
- show: true,
- position: 'center',
- padding: [15, 0, 0, -10],
- formatter: function (value) {
- return value.data + '%';
- }
- }
- },
- {
- name: cl,
- type: 'scatter',
- symbol: 'pin', //'circle', 'rect', 'roundRect', 'triangle', 'diamond', 'pin', 'arrow'
- symbolSize: function (data) {
- return data[3] * 10;
- },
- symbolColor: 'red',
- itemStyle: {
- normal: {
- color: function (data) {
- if (data.data[2] === 'A') {
- return colorList[1];
- } else if (data.data[2] === 'B') {
- return colorList[2];
- } else if (data.data[2] === 'C') {
- return colorList[3];
- } else if (data.data[2] === 'D') {
- return colorList[0];
- }
- }
- }
- },
- label: {
- show: true,
- color: '#000',
- formatter: function (value) {
- return value.data[3] + '题';
- },
- },
- data: xName
- });
- });
-
- option = {
- textStyle: {
- color: '#666'
- },
- yAxis: {
- name: '掌握率(%)',
- max: 100,
- min: 0,
- splitLine: {
- lineStyle: {
- type: 'dashed'
- }
- },
- scale: false
- },
- xAxis: {
- name: '知识点',
- data: datas.map((m) => {
- return m.name;
- })
- },
- color: colorList,
- legend: {
- show: true,
- top: 0,
- itemGap: 30,
- data: className
- },
- series: series
- };
希望我的愚见能够帮助你哦~,若有不足之处,还望指出,你们有更好的解决方法,欢迎大家在评论区下方留言支持,大家一起相互学习参考呀~
声明:本文内容由网友自发贡献,不代表【wpsshop博客】立场,版权归原作者所有,本站不承担相应法律责任。如您发现有侵权的内容,请联系我们。转载请注明出处:https://www.wpsshop.cn/w/黑客灵魂/article/detail/904340?site=
推荐阅读
相关标签

