
热门标签
热门文章
- 1《敏捷软件开发》阅读笔记_敏捷软件开发读书笔记
- 2【嵌入式烧录/刷写文件】-3.1-详解二进制Bin格式文件_bin文件结构
- 3记SQL Server实战修复死锁总结_sql server ghost cleanup 锁 数据库无法读取
- 4简单介绍Go语言中切片的长度与容量的区别_golang slice 容量
- 5疫情被裁3个月,看我如何拿下腾讯offer(附面经+面试心得)_腾讯外包面试
- 627岁Python独立开发者,年收入超900万,过着令人羡慕的生活_python之父的收入(2)
- 7Git 第二章 -- Git 安装和卸载_git卸载重装
- 8leetcode 2760 解决最长交替子数组问题_交替子数组和
- 9kafka的基本使用_卡夫卡使用
- 10嵌入式Linux-线程同步-互斥锁_ccriticalsection lock在linux下面怎么用
当前位置: article > 正文
【Python-3.5】matplotlib绘制气温折线图_pointf python
作者:羊村懒王 | 2024-06-12 22:16:48
赞
踩
pointf python
本文案例源自《Python编程:从入门到实践》,章节16.1,我对书中代码进行了简单改进。代码中先导入CSV文件,然后对文件中的数据进行处理,最后展示为折线图。
sitka_weather_07-2014.csv
- AKDT,Max TemperatureF,Mean TemperatureF,Min TemperatureF,Max Dew PointF,MeanDew PointF,Min DewpointF,Max Humidity, Mean Humidity, Min Humidity, Max Sea Level PressureIn, Mean Sea Level PressureIn, Min Sea Level PressureIn, Max VisibilityMiles, Mean VisibilityMiles, Min VisibilityMiles, Max Wind SpeedMPH, Mean Wind SpeedMPH, Max Gust SpeedMPH,PrecipitationIn, CloudCover, Events, WindDirDegrees
- 2014-7-1,64,56,50,53,51,48,96,83,58,30.19,30.00,29.79,10,10,10,7,4,,0.00,7,,337
- 2014-7-2,71,62,55,55,52,46,96,80,51,29.81,29.75,29.66,10,9,2,13,5,,0.14,7,Rain,327
- 2014-7-3,64,58,53,55,53,51,97,85,72,29.88,29.86,29.81,10,10,8,15,4,,0.01,6,,258
- 2014-7-4,59,56,52,52,51,50,96,88,75,29.91,29.89,29.87,10,9,2,9,2,,0.07,7,Rain,255
- 2014-7-5,69,59,50,52,50,46,96,72,49,29.88,29.82,29.79,10,10,10,13,5,,0.00,6,,110
- 2014-7-6,62,58,55,51,50,46,80,71,58,30.13,30.07,29.89,10,10,10,20,10,29,0.00,6,Rain,213
- 2014-7-7,61,57,55,56,53,51,96,87,75,30.10,30.07,30.05,10,9,4,16,4,25,0.14,8,Rain,211
- 2014-7-8,55,54,53,54,53,51,100,94,86,30.10,30.06,30.04,10,6,2,12,5,23,0.84,8,Rain,159
- 2014-7-9,57,55,53,56,54,52,100,96,83,30.24,30.18,30.11,10,7,2,9,5,,0.13,8,Rain,201
- 2014-7-10,61,56,53,53,52,51,100,90,75,30.23,30.17,30.03,10,8,2,8,3,,0.03,8,Rain,215
- 2014-7-11,57,56,54,56,54,51,100,94,84,30.02,30.00,29.98,10,5,2,12,5,,1.28,8,Rain,250
- 2014-7-12,59,56,55,58,56,55,100,97,93,30.18,30.06,29.99,10,6,2,15,7,26,0.32,8,Rain,275
- 2014-7-13,57,56,55,58,56,55,100,98,94,30.25,30.22,30.18,10,5,1,8,4,,0.29,8,Rain,291
- 2014-7-14,61,58,55,58,56,51,100,94,83,30.24,30.23,30.22,10,7,0,16,4,,0.01,8,Fog,307
- 2014-7-15,64,58,55,53,51,48,93,78,64,30.27,30.25,30.24,10,10,10,17,12,,0.00,6,,318
- 2014-7-16,61,56,52,51,49,47,89,76,64,30.27,30.23,30.16,10,10,10,15,6,,0.00,6,,294
- 2014-7-17,59,55,51,52,50,48,93,84,75,30.16,30.04,29.82,10,10,6,9,3,,0.11,7,Rain,232
- 2014-7-18,63,56,51,54,52,50,100,84,67,29.79,29.69,29.65,10,10,7,10,5,,0.05,6,Rain,299
- 2014-7-19,60,57,54,55,53,51,97,88,75,29.91,29.82,29.68,10,9,2,9,2,,0.00,8,,292
- 2014-7-20,57,55,52,54,52,50,94,89,77,29.92,29.87,29.78,10,8,2,13,4,,0.31,8,Rain,155
- 2014-7-21,69,60,52,53,51,50,97,77,52,29.99,29.88,29.78,10,10,10,13,4,,0.00,5,,297
- 2014-7-22,63,59,55,56,54,52,90,84,77,30.11,30.04,29.99,10,10,10,9,3,,0.00,6,Rain,240
- 2014-7-23,62,58,55,54,52,50,87,80,72,30.10,30.03,29.96,10,10,10,8,3,,0.00,7,,230
- 2014-7-24,59,57,54,54,52,51,94,84,78,29.95,29.91,29.89,10,9,3,17,4,28,0.06,8,Rain,207
- 2014-7-25,57,55,53,55,53,51,100,92,81,29.91,29.87,29.83,10,8,2,13,3,,0.53,8,Rain,141
- 2014-7-26,57,55,53,57,55,54,100,96,93,29.96,29.91,29.87,10,8,1,15,5,24,0.57,8,Rain,216
- 2014-7-27,61,58,55,55,54,53,100,92,78,30.10,30.05,29.97,10,9,2,13,5,,0.30,8,Rain,213
- 2014-7-28,59,56,53,57,54,51,97,94,90,30.06,30.00,29.96,10,8,2,9,3,,0.61,8,Rain,261
- 2014-7-29,61,56,51,54,52,49,96,89,75,30.13,30.02,29.95,10,9,3,14,4,,0.25,6,Rain,153
- 2014-7-30,61,57,54,55,53,52,97,88,78,30.31,30.23,30.14,10,10,8,8,4,,0.08,7,Rain,160
- 2014-7-31,66,58,50,55,52,49,100,86,65,30.31,30.29,30.26,10,9,3,10,4,,0.00,3,,217

代码如下:
- import csv
-
- from matplotlib import pyplot as plt
- from datetime import datetime
-
- file_name = 'sitka_weather_07-2014.csv'
- with open(file_name) as f:
- reader = csv.reader(f)
- header_row = next(reader)
-
- dates,highs,lows = [],[],[]
- for row in reader:
- current_date = datetime.strptime(row[0],'%Y-%m-%d')
- dates.append(current_date)
-
- high = int(row[1])
- highs.append(high)
-
- low = int(row[3])
- lows.append(low)
-
-
- # 根据文件数据绘制图形
- fig = plt.figure(dpi=128,figsize=(8,5))
- plt.plot(dates,highs,label='High',c='red')
- plt.plot(dates,lows,label='Low',c='blue')
-
- # 设置图形格式
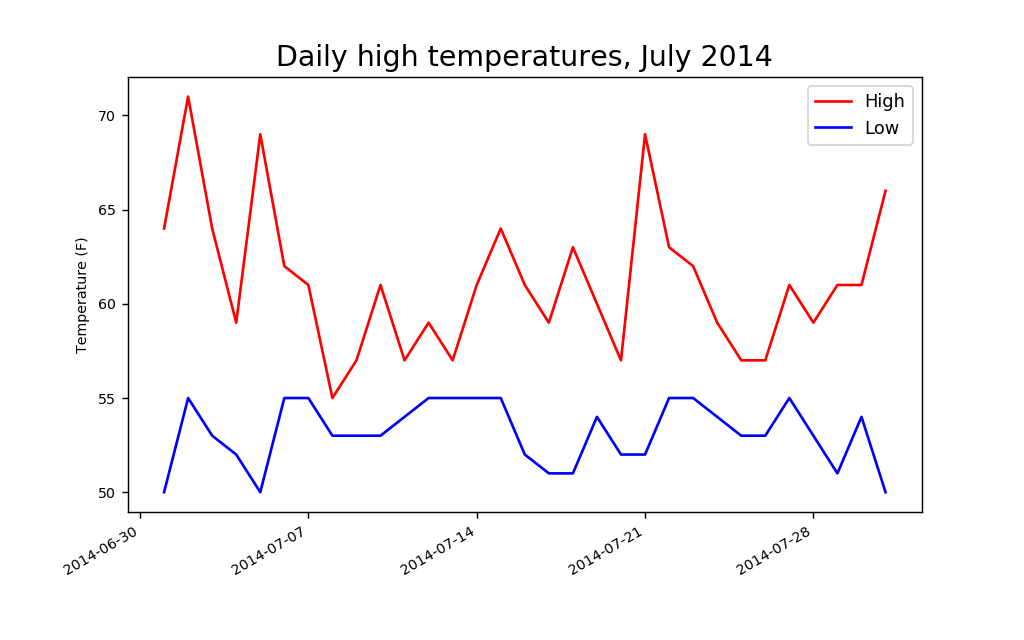
- plt.title("Daily high temperatures, July 2014",fontsize=24)
- plt.xlabel('',fontsize=16)
- fig.autofmt_xdate()
- plt.ylabel("Temperature (F)",fontsize=16)
- plt.tick_params(axis='both',which='major',labelsize=16)
-
- plt.legend()
- plt.show()
效果图如下:
声明:本文内容由网友自发贡献,不代表【wpsshop博客】立场,版权归原作者所有,本站不承担相应法律责任。如您发现有侵权的内容,请联系我们。转载请注明出处:https://www.wpsshop.cn/w/羊村懒王/article/detail/709855?site
推荐阅读

相关标签

