
- 1服务注册/服务发现-Eureka
- 2centos 查看mysql 服务器配置_在CentOS上MySQL数据库服务器配置方法
- 3修改mysql数据储存位置_更改Mysql数据库数据存储位置的具体步骤
- 4C++数据结构与算法分析——Floyd算法_floyd算法 c++
- 5Linux中的crontab 定时任务设置_linux定时任务凌晨5点时执行一次
- 6elasticsearch_Elasticsearch入门教程
- 7系统主数据管理之物料(Item)四 Item的单位(UOM)
- 8大模型备案关注点最详细说明【附流程+附件】_生成式人工智能大模型备案拦截关键词列表怎么写
- 9vue简单侧边栏封装+模拟侧边栏标签淡入淡出_vue添加侧边框
- 10安全隧道技术
Go prometheus笔记_golang prometheus collector
赞
踩
关键字:go,exporter,prometheus,collector
exporter是什么?和prometheus什么关系?
Prometheus Exporter是一个用来收集和暴露指标数据的工具,通过与Prometheus监控系统一起使用。
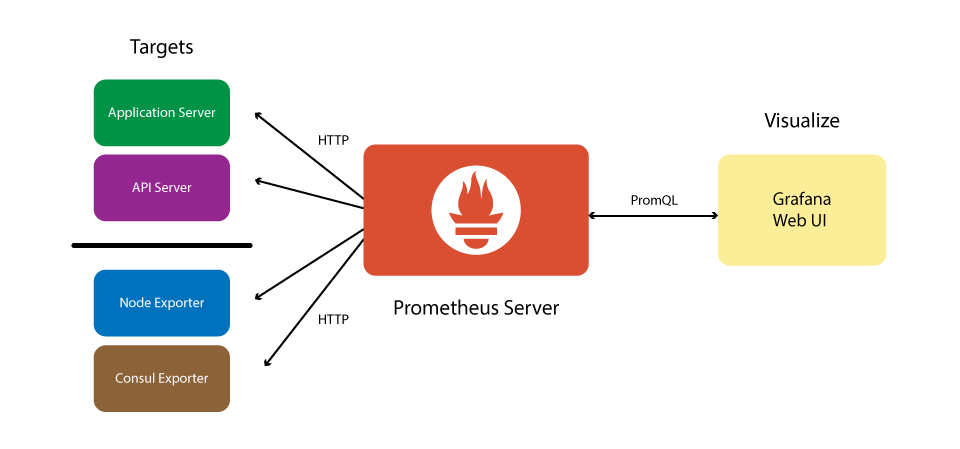
或者说,为Prometheus提供监控数据源的都被称为Exporter,比如Node Exporter用来提供节点相关的资源(cpu、内存、disk…)使用状况,而Prometheus从这些不同的Exporter中获取监控数据,然后可以在诸如Grafana这样的可视化工具中进行结果的显示。
exporter,prometheus, grafana关系:
collector是什么?
collector是exporter中的一部分,通过Collector来收集指标数据,并将其转换为合适的指标格式。(到底谁转换?)
exporter和collector的关系?
Exporter会从Collector获取指标数据,并将其转成为Prometheus可读格式。(?
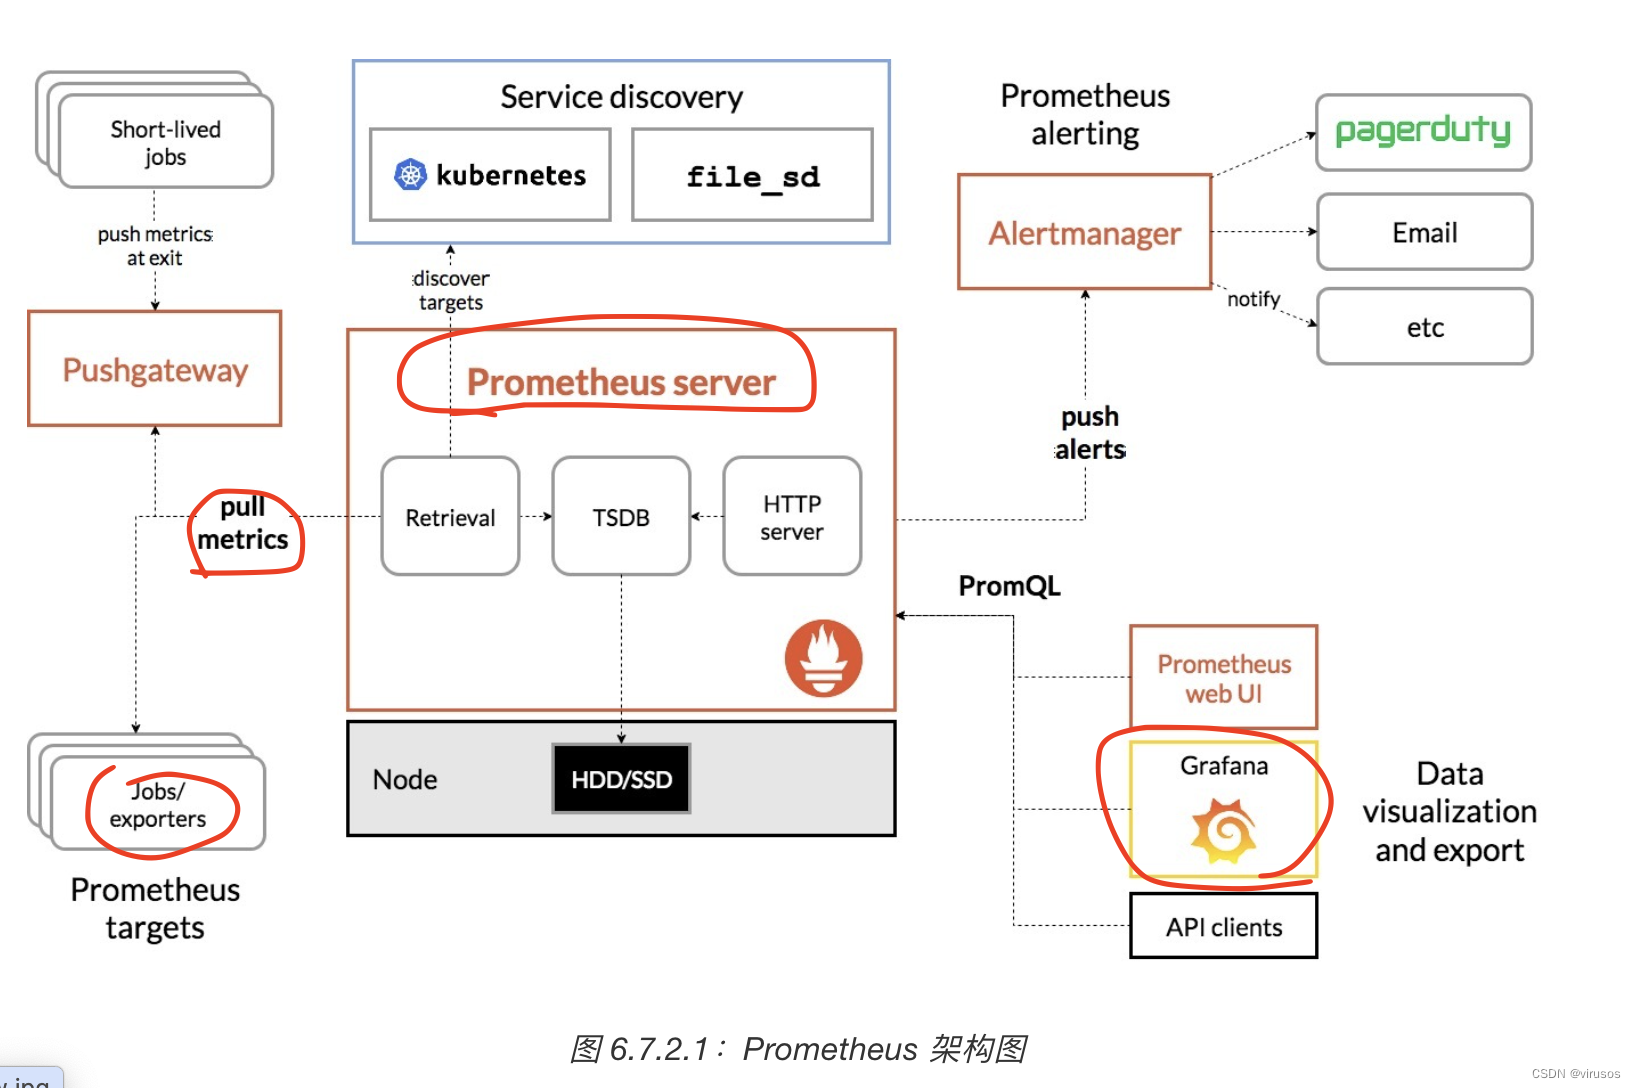
prometheus server又是什么?
它是一个用于存储和查询指标数据的中心化实践序列数据库服务器。Prometheus Server使用scrape_configs的YAML配置文件,其中指定了每个Exporter的配置信息,包括URL、抓取间隔等。
Prometheus 指标(metric)格式是什么?
metric_name {label_key="label_value", ...} value timestamp
- 1
http_request_duration_seconds_bucket{le="0.2"} 150
http_request_duration_seconds_bucket{le="0.5"} 200
- 1
- 2
其中,”http_request_duration_seconds_bucket”是度量名称,”le”是标签名,”0.2”、”0.5”是标签值, 150、200是相应的值,时间戳则通常省略不写。
metric在prometheus中会用在哪些地方?
Prometheus指标格式的应用包括:
1.收集指标数据:在Prometheus Exporter中,我们通过Collector来收集指标数据,并将其转换为合适的指标格式。
2.暴露指标数据:Prometheus Exporter会把采集到的指标数据暴露给Prometheus,使得Prometheus能够对其进行监控和分析。
3.查询指标数据:在Prometheus中,我们可以使用PromQL查询语言对指标数据查询和分析,比如计算指标的平均值、最大值、最小值等等。
4.可视化指标:通过Grafana等可视化工具,我们可以将Prometheus收集到的指标数据进行图表展示和监控报警等操作。

