
- 1数字货币量化交易系统搭建学习--1 区块链技术_区块链量化交易系统
- 2百度智能云.图像特效:图像风格转换&黑白图像上色_百度智能云黑白图像
- 32024年第三届钉钉杯大学生大数据挑战赛初赛题目初赛B:医疗门诊患者及用药数据案例分析 思路代码(着重更新B题,A题只更新一部分)
- 4Python数据结构与算法——算法(贪心算法、动态规划)_假设有n个活动这些活动要占用同一场地,而场地在某时刻只能提供一个活动使用,
- 5力扣刷题第一题(1137. 第 N 个泰波那契数)_泰波那契序列 tn 定义如下:to = 0,t1 = 1,t2 = 1,且在n >=0 的条件下tn
- 6实现 AI 辅助软件工程:团队如何量身打造 AI4SE 体系?
- 7前端el-table-column使用template的新发现哈哈哈_el-table-column template
- 8自定义监控进程、日志、mysql主从状态、mysql主从延迟_监控mysql主从
- 9Redis数据类型有哪些?_redis八种数据类型
- 10防火墙策略长时间未进行审查,可能包含已过时或不再需要的规则,增加了安全风险_防火墙到期隐患
毕业设计:Python租房数据爬取分析可视化系统 爬虫+全国租房数据+Echarts可视化+Django框架(附源码+文档)✅_python爬取租房信息小区名 户型 面积 楼层 建成时间的信息
赞
踩
博主介绍:✌全网粉丝10W+,前互联网大厂软件研发、集结硕博英豪成立工作室。专注于计算机相关专业毕业设计项目实战6年之久,选择我们就是选择放心、选择安心毕业✌感兴趣的可以先收藏起来,点赞、关注不迷路✌
毕业设计:2023-2024年计算机毕业设计1000套(建议收藏)
毕业设计:2023-2024年最新最全计算机专业毕业设计选题汇总
1、项目介绍
基于Python的租房数据分析系统+爬虫
Python租房数据分析系统 爬虫 全国租房数据 大数据 房屋数据分析
Django框架、requests爬虫、Echarts可视化、全国租房数据、贝壳租房网
技术栈: python语言 bootstrap框架 jquery css javascript html
爬取网站: 贝壳租房 https://bj.zu.ke.com/zufang/ (可爬取全国各城市数据)
功能:租房信息数据展示、租房地址数量分布、租房类型统计、租房价格统计分析、租房面积分析、房屋朝向分析、房屋户型平均价格统计分析、房屋楼层统计分析、房屋楼层与价格统计分析、房屋地址与价格统计分析、房屋相关信息词云展示
2、项目界面
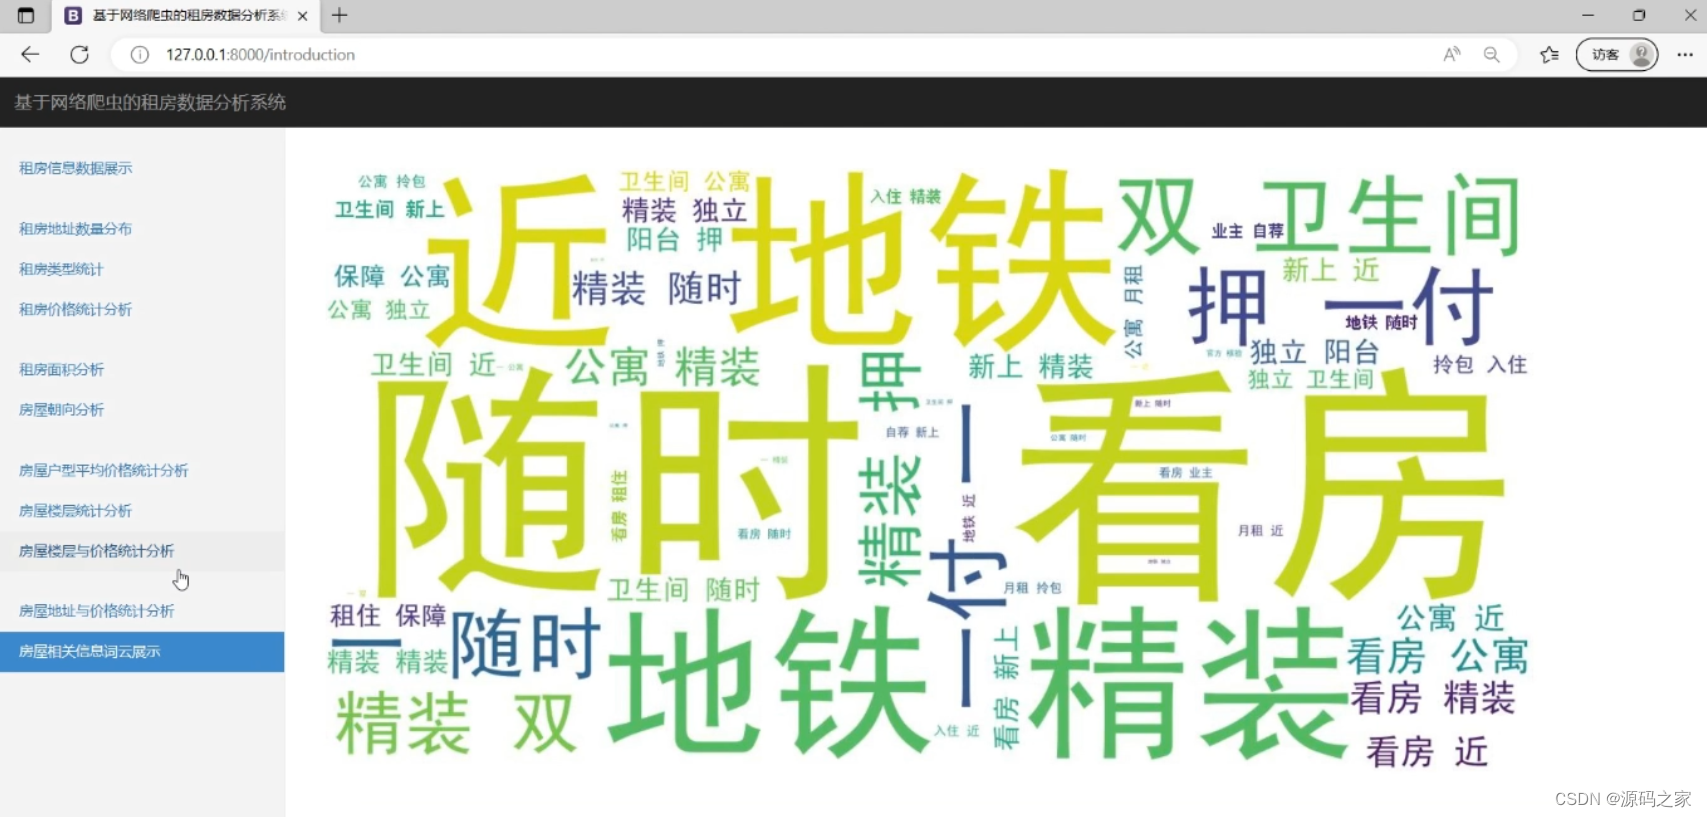
(1)词云图分析
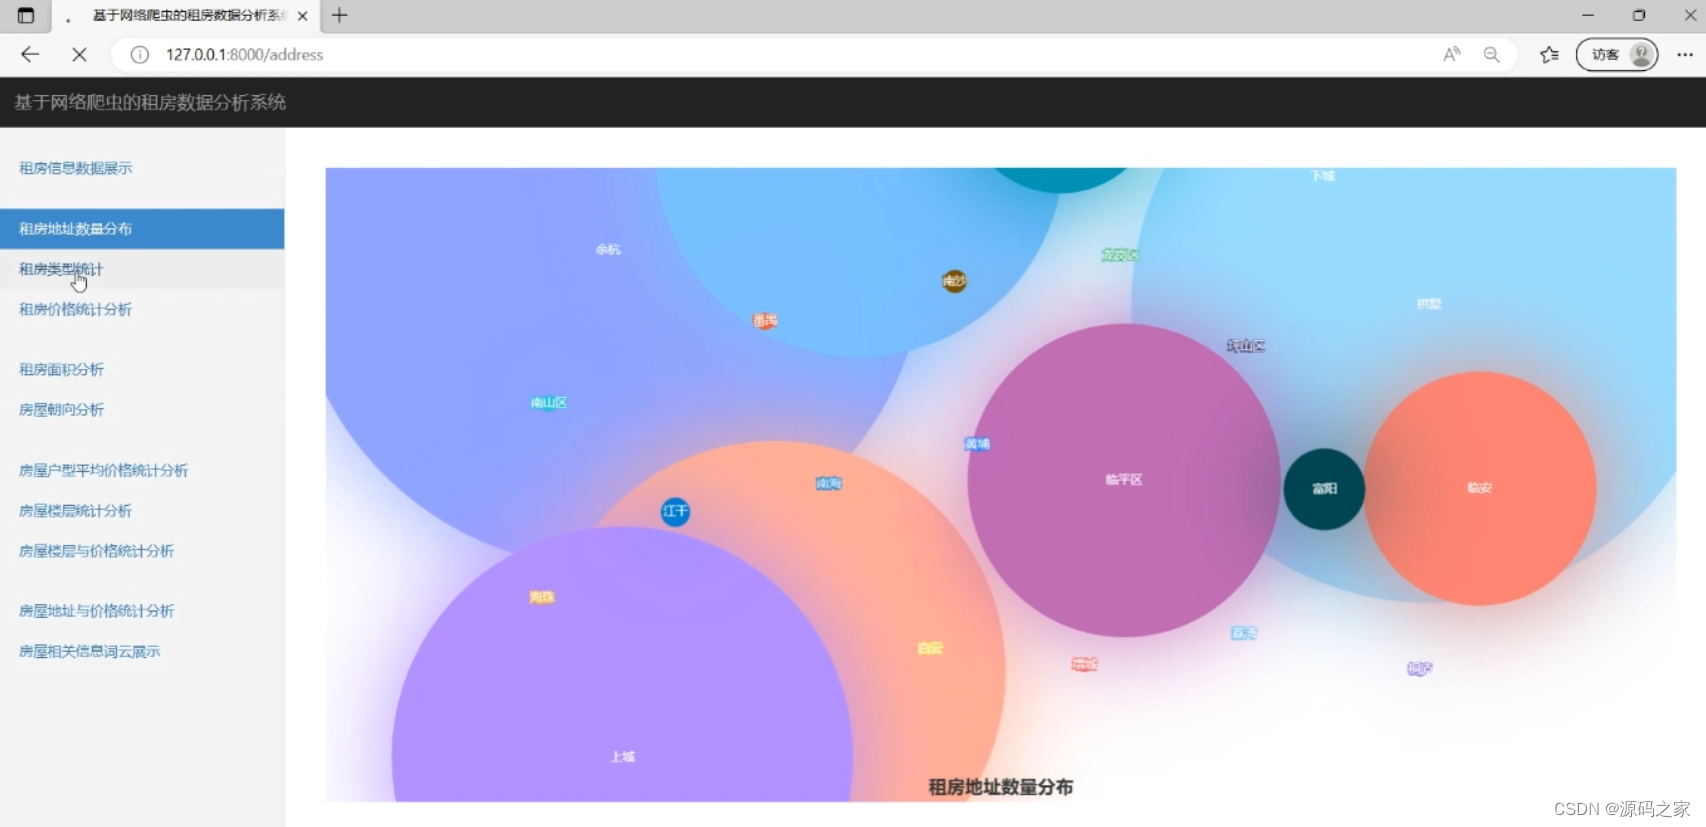
(2)房屋地址数量分布分析
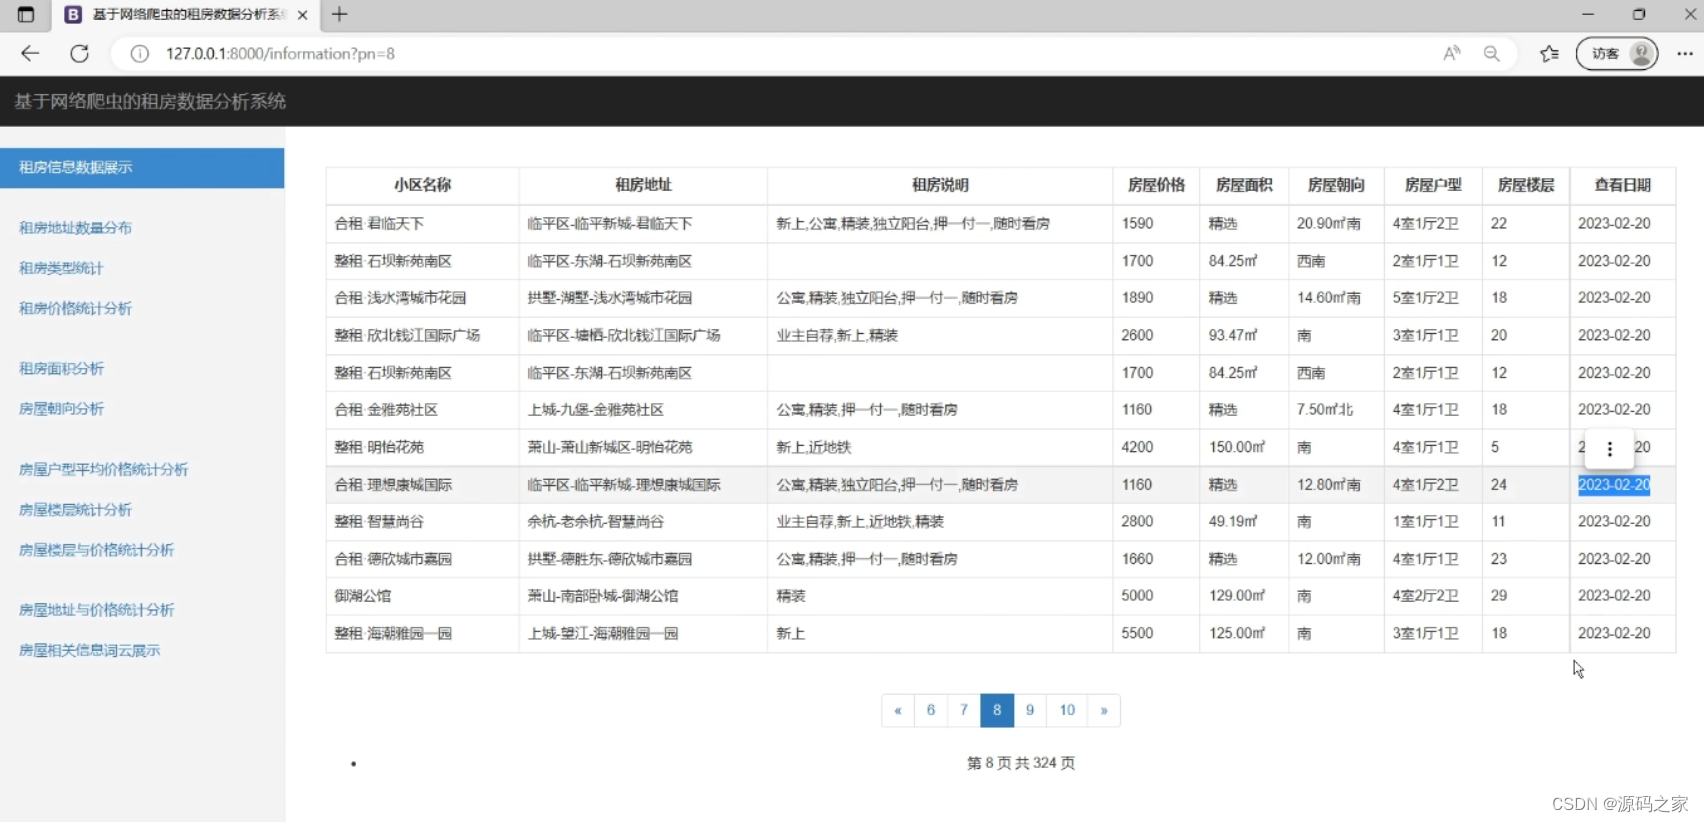
(3)租房数据
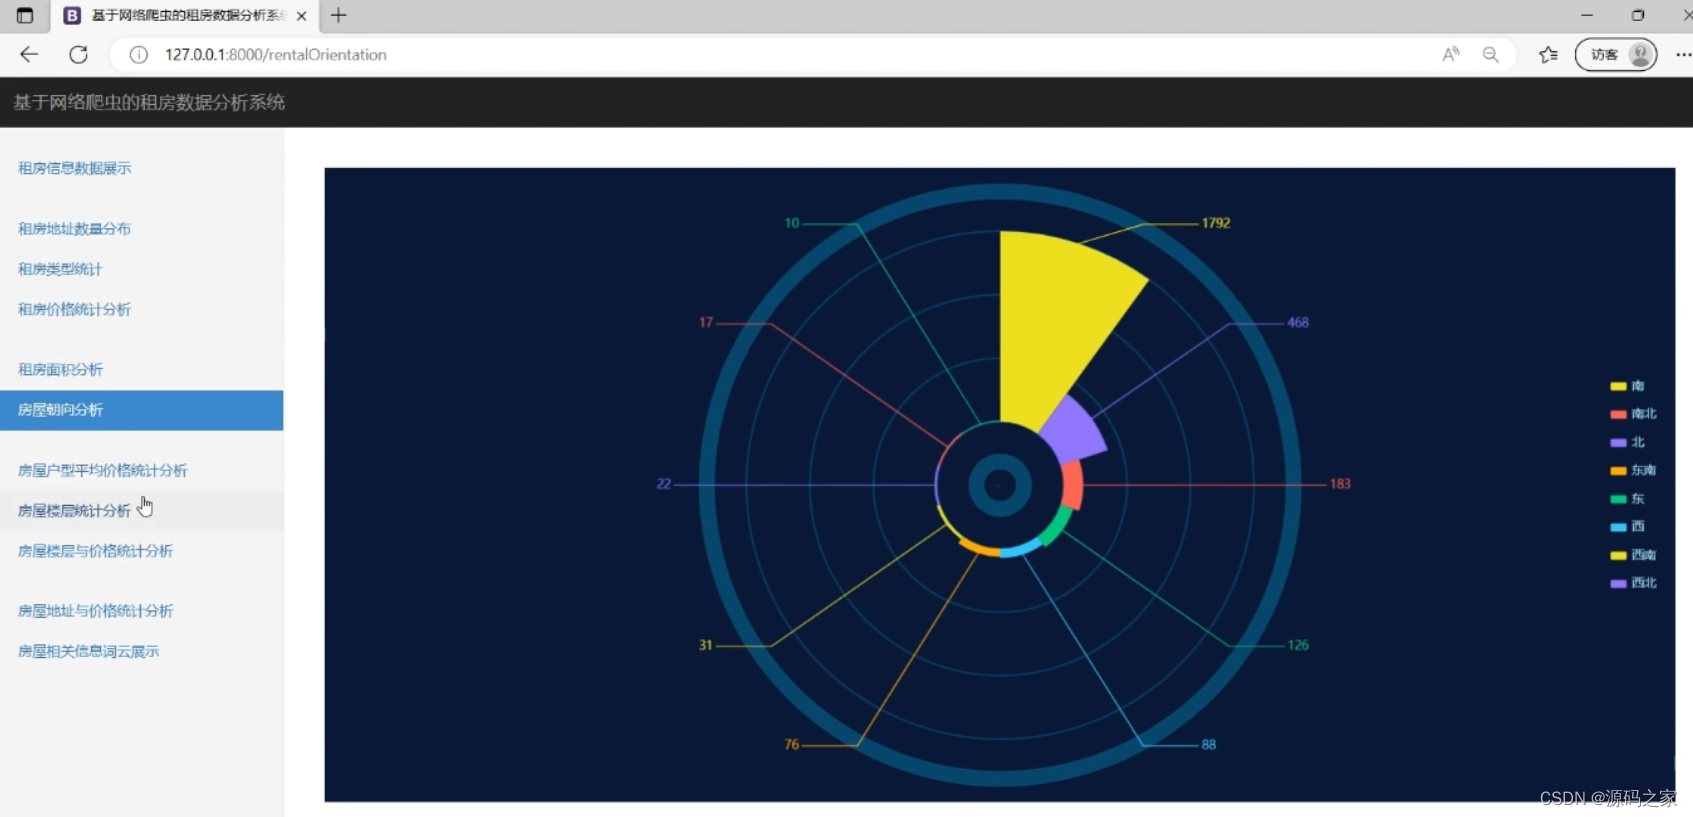
(4)房屋朝向分析
3、项目说明
基于Python的租房数据分析系统+爬虫
Python租房数据分析系统 爬虫 全国租房数据 大数据 房屋数据分析
Django框架、requests爬虫、Echarts可视化、全国租房数据、贝壳租房网
技术栈: python语言 bootstrap框架 jquery css javascript html
爬取网站: 贝壳租房 https://bj.zu.ke.com/zufang/ (可爬取全国各城市数据)
功能:租房信息数据展示、租房地址数量分布、租房类型统计、租房价格统计分析、租房面积分析、房屋朝向分析、房屋户型平均价格统计分析、房屋楼层统计分析、房屋楼层与价格统计分析、房屋地址与价格统计分析、房屋相关信息词云展示
基于Python的租房数据分析系统是一个基于Django框架开发的Web应用程序,用于分析全国各城市的租房数据。系统使用requests库进行数据爬取,爬取的数据来自于贝壳租房网。系统还使用Echarts库进行数据可视化展示。
系统的功能包括以下几个方面:
-
租房信息数据展示:系统可以展示爬取到的租房信息,包括房屋标题、租金、面积、户型、楼层、朝向、地址等信息。
-
租房地址数量分布:系统可以根据爬取到的租房数据,统计各个地址的租房数量,并以地图的形式展示出来。
-
租房类型统计:系统可以统计不同类型的租房数量,如整租、合租等,并以柱状图展示。
-
租房价格统计分析:系统可以对租房价格进行统计分析,包括平均租金、最高租金、最低租金等,并以柱状图展示。
-
租房面积分析:系统可以对租房面积进行统计分析,包括平均面积、最大面积、最小面积等,并以柱状图展示。
-
房屋朝向分析:系统可以对房屋朝向进行统计分析,包括南北朝向、东西朝向等,并以饼图展示。
-
房屋户型平均价格统计分析:系统可以统计不同户型的平均租金,并以柱状图展示。
-
房屋楼层统计分析:系统可以统计不同楼层的租房数量,并以柱状图展示。
-
房屋楼层与价格统计分析:系统可以统计不同楼层的租房平均租金,并以折线图展示。
-
房屋地址与价格统计分析:系统可以根据地址统计租房平均租金,并以柱状图展示。
-
房屋相关信息词云展示:系统可以对租房相关信息进行分析,生成词云图展示。
通过以上功能,用户可以更好地了解全国各城市的租房情况,帮助用户在租房过程中做出更好的决策。同时,系统还提供了数据可视化展示,使用户能够更直观地了解数据分析结果。
4、核心代码
# coding:utf8
import os
import re
import json
from audioop import reverse
from os import path
import sqlite3
from urllib.request import urlretrieve
import jieba
from PIL import Image
from django.contrib.auth import authenticate
from django.http import HttpResponseRedirect
from django.shortcuts import render, HttpResponse, redirect
from django.contrib.auth.decorators import login_required    # 导入登录验证
from django.views.generic import View, ListView   # 视图基类
from datetime import datetime
import hashlib
# 导入模型
from wordcloud import WordCloud, ImageColorGenerator

from app00 import models
from django.conf import settings
# 创建模板对象
from django.template import Template, Context
# 导入分页类
from django.core.paginator import Paginator, InvalidPage, EmptyPage, PageNotAnInteger
# 导入数据分析类
import pymysql
import pandas as pd
import numpy as np
from django.urls import reverse,resolve
# 租房类型统计
def rentalType(request):
    data = obtainData()
    # 缺失值处理
    data.dropna(subset=['community'], inplace=True)
    types = data['community'].values
    type = []
    for m in types:
        type.append(m[:2])
    typeData = pd.DataFrame({"rentalType": type})
    # print(addData)
    typeDict = dict(typeData.rentalType.value_counts())
    for k in [*typeDict.keys()]:
        if k not in ['整租','合租','独栋']:
            del typeDict[k]
    typeList = list(typeDict.keys())
    typeCount = list(typeDict.values())
    print(typeDict)
    # print(typeList)
    # print(typeCount)
    pi = []
    for i in typeCount:
        pi.append(i / 2850)
    context = {
        "rentalType": "active",
        "typeDict":json.dumps({k:int(v) for k,v in typeDict.items()}),
    }
    return render(request, 'visualization/rentalType.html', context)


# 租房价格统计分析
def rentalPrice(request):
    data = obtainData()
    # 缺失值处理
    data.dropna(subset=['price'], inplace=True)
    prices = data['price'].values
    price = []
    for m in prices:
        # 有的价格数据是区间形式,需要进行处理, 求平均值
        if '-' in m:
            temp = m.split('-')
            price.append((int(temp[0]) + int(temp[1])) / 2)
        else:
            price.append(int(m))
    # print(price)
    # 进行数据统计
    a, b, c, d, e = (0, 0, 0, 0, 0)
    for t in price:
        if t < 1000:
            a += 1
        elif 1000 <= t < 2000:
            b += 1
        elif 2000 <= t < 3000:
            c += 1
        elif 3000 <= t < 4000:
            d += 1
        else:
            e += 1
    priceList = ['1000以下', '1000-2000', '2000-3000', '3000-4000', '4000以上']
    priceCount = [a, b, c, d, e]
    print(dict(zip(priceList,priceCount)))
    context = {
        "rentalPrice": "active",
        "priceList": priceList,
        "priceCount": priceCount
    }
    return render(request, 'visualization/rentalPrice.html', context)


# 租房面积分析
def rentalArea(request):
    data = obtainData()
    # 缺失值处理
    data.dropna(subset=['area'], inplace=True)
    areas = data['area'].values
    area = []
    for m in areas:
        try:
            area.append(float(m[:-1]))
        except:
            area.append(0)

    a, b, c, d, e, f = (0, 0, 0, 0, 0, 0)
    for t in area:
        if t <= 10:
            a += 1
        elif 10 < t <= 50:
            b += 1
        elif 50 < t <= 100:
            c += 1
        elif 100 < t <= 120:
            d += 1
        elif 120 < t <= 150:
            e += 1
        else:
            f += 1
    areaList = ['10平方以下', '10-50', '50-100', '100-120', '120-150', '150平方以上']
    areaCount = [a, b, c, d, e, f]
    context = {
        "rentalArea": "active",
        "areaList": areaList,
        "areaCount": areaCount
    }
    print(dict(zip(areaList,areaCount)))
    return render(request, 'visualization/rentalArea.html', context)


# 房屋朝向分析
def rentalOrientation(request):
    data = obtainData()
    orientationDict = dict(data.orientation.value_counts())
    orientationList = list(orientationDict.keys())
    orientationList = orientationList[:15] + orientationList[18:20]
    orientationCount = list(orientationDict.values())
    orientationCount = orientationCount[:15] + orientationCount[18:20]
    # print(orientationDict)
    # print(orientationList)
    # print(orientationCount)
    context = {
        "rentalOrientation": "active",
        "orientationList": orientationList[:10],
        "orientationCount": orientationCount[:10]
    }
    print(dict(zip(orientationList[:10],orientationCount[:10])))
    return render(request, 'visualization/rentalOrientation.html', context)


# 房屋户型平均价格统计分析
def rentalPattern(request):
    data = obtainData()
    data.dropna(how='any', inplace=True)
    """
    print(len(data.price.values))
    for i in range(len(data.price.values)):
        if '-' in str(data.price.values[i]):
            data.drop(data.index[i], inplace=True)
    """
    data['price'] = data['price'].map(lambda x:re.search(r'\d+',x).group()).astype(int)
    group = data.groupby('pattern').price.mean()
    patternDict = dict(data.pattern.value_counts())
    patternList = list(group.index)
    t = list(group.values)
    patternCount = []
    for i in t:
        patternCount.append(int(i))
    # print(type(group))
    # print(group.index)
    # print(group.values)
    context = {
        "rentalPattern": "active",
        "patternList": patternList[:10],
        "patternCount": patternCount[:10]
    }
    print(dict(zip(patternList[:10],patternCount[:10])))
    return render(request, 'visualization/rentalPattern.html', context)


# 房屋楼层统计分析
def rentalFloor(request):
    data = obtainData()
    # 缺失值处理
    data.dropna(subset=['floor'], inplace=True)
    m = data.floor.values
    dataNew = []
    for i in m:
        dataNew.append(i[:3])
    p = pd.DataFrame({"data": dataNew})
    rentalFloorDict = dict(p["data"].value_counts())
    rentalFloorDict=dict(sorted([[k,v] for k,v in rentalFloorDict.items()],key=lambda x:int(x[0])))
    rentalFloorList = list(rentalFloorDict.keys())
    rentalFloorCount = list(rentalFloorDict.values())
    # print(rentalFloorDict)
    context = {
        "rentalFloor": 'active',
        "rentalFloorList": rentalFloorList[:],
        "rentalFloorCount": rentalFloorCount[:]
    }
    print(dict(zip(rentalFloorList[:],rentalFloorCount[:])))
    return render(request, 'visualization/rentalFloor.html', context)


# 房屋楼层与价格统计分析
def floorAndPrice(request):
    data = obtainData()
    data.dropna(how='any', inplace=True)
    data[['price']] = data[['price']].astype(float)

    m = data.floor.values
    dataNew = []
    for i in m:
        dataNew.append(i[:3])
    p = pd.DataFrame({"floor": dataNew, 'price': list(data.price.values)})
    level=pd.cut(p['floor'].astype(int),bins=3,right=True,labels=['低楼层','中楼层','高楼层'])
    p['level'] = level
    group = p.groupby('level').price.mean()
    print(group)
    # print(group)
    floorAndPriceList = list(group.index)
    t = list(group.values)
    floorAndPriceCount = []
    for i in t:
        floorAndPriceCount.append(int(i))
    context = {
        "floorAndPrice": "active",
        "floorAndPriceDict":json.dumps(dict(zip(floorAndPriceList[:],floorAndPriceCount[:])))
        # "floorAndPriceList": floorAndPriceList,
        # "floorAndPriceCount": floorAndPriceCount
    }
    print(dict(zip(floorAndPriceList[:],floorAndPriceCount[:])))
    return render(request, 'visualization/floorAndPrice.html', context)


# 房屋地址与价格统计分析
def addressAndPrice(request):
    data = obtainData()
    data.dropna(how='any', inplace=True)
    data[['price']] = data[['price']].astype(float)

    m = data.address.values
    dataNew = []
    for i in m:
        dataNew.append(i.split('-')[0])
    p = pd.DataFrame({"address": dataNew, 'price': list(data.price.values)})
    group = p.groupby('address').price.mean()
    # print(group)
    addressAndPriceList = list(group.index)
    t = list(group.values)
    addressAndPriceCount = []
    for i in t:
        addressAndPriceCount.append(int(i))
    # print(addressAndPriceList)
    # print(addressAndPriceCount)
    dd = [{"address":k,"count":v}for k,v in dict(zip(addressAndPriceList[:],addressAndPriceCount[:])).items()]
    context = {
        "addressAndPrice": "active",
        "addressAndPriceDict":json.dumps(dd)
        # "addressAndPriceList": addressAndPriceList[1:],
        # "addressAndPriceCount": addressAndPriceCount[1:]
    }
    print(dict(zip(addressAndPriceList[:],addressAndPriceCount[:])))
    return render(request, 'visualization/addressAndPrice.html', context)


# 房屋相关信息词云展示
def introduction(request):
    context = {
        "introduction": "active"
    }
    return render(request, 'visualization/introduction.html', context)


def introduction_pic(request):
    data = obtainData()
    data = data.dropna()
    m = data['introduction'].values
    result = []
    for i in m:
        result.append(i)

    txt = ' '.join(result)
    # join() 方法用于将序列中的元素以指定的字符连接生成一个新的字符串
    cut_text = " ".join(jieba.cut(txt))
    # mask参数=图片背景,必须要写上,另外有mask参数再设定宽高是无效的
    wordcloud = WordCloud(font_path="./simhei.ttf", background_color="white",width=1200,height=600).generate(cut_text)
    wordcloud.to_file("test.jpg")
    return HttpResponse(open('test.jpg','rb').read(),content_type="image/jpg")

- 1
- 2
- 3
- 4
- 5
- 6
- 7
- 8
- 9
- 10
- 11
- 12
- 13
- 14
- 15
- 16
- 17
- 18
- 19
- 20
- 21
- 22
- 23
- 24
- 25
- 26
- 27
- 28
- 29
- 30
- 31
- 32
- 33
- 34
- 35
- 36
- 37
- 38
- 39
- 40
- 41
- 42
- 43
- 44
- 45
- 46
- 47
- 48
- 49
- 50
- 51
- 52
- 53
- 54
- 55
- 56
- 57
- 58
- 59
- 60
- 61
- 62
- 63
- 64
- 65
- 66
- 67
- 68
- 69
- 70
- 71
- 72
- 73
- 74
- 75
- 76
- 77
- 78
- 79
- 80
- 81
- 82
- 83
- 84
- 85
- 86
- 87
- 88
- 89
- 90
- 91
- 92
- 93
- 94
- 95
- 96
- 97
- 98
- 99
- 100
- 101
- 102
- 103
- 104
- 105
- 106
- 107
- 108
- 109
- 110
- 111
- 112
- 113
- 114
- 115
- 116
- 117
- 118
- 119
- 120
- 121
- 122
- 123
- 124
- 125
- 126
- 127
- 128
- 129
- 130
- 131
- 132
- 133
- 134
- 135
- 136
- 137
- 138
- 139
- 140
- 141
- 142
- 143
- 144
- 145
- 146
- 147
- 148
- 149
- 150
- 151
- 152
- 153
- 154
- 155
- 156
- 157
- 158
- 159
- 160
- 161
- 162
- 163
- 164
- 165
- 166
- 167
- 168
- 169
- 170
- 171
- 172
- 173
- 174
- 175
- 176
- 177
- 178
- 179
- 180
- 181
- 182
- 183
- 184
- 185
- 186
- 187
- 188
- 189
- 190
- 191
- 192
- 193
- 194
- 195
- 196
- 197
- 198
- 199
- 200
- 201
- 202
- 203
- 204
- 205
- 206
- 207
- 208
- 209
- 210
- 211
- 212
- 213
- 214
- 215
- 216
- 217
- 218
- 219
- 220
- 221
- 222
- 223
- 224
- 225
- 226
- 227
- 228
- 229
- 230
- 231
- 232
- 233
- 234
- 235
- 236
- 237
- 238
- 239
- 240
- 241
- 242
- 243
- 244
- 245
- 246
- 247
- 248
- 249
- 250
- 251
- 252
- 253
- 254
- 255
- 256
- 257
- 258
- 259
- 260
- 261
- 262
- 263
- 264
- 265
- 266
- 267
- 268
- 269
- 270
- 271
- 272
- 273
- 274
- 275
- 276
- 277
- 278
- 279
- 280
- 281
- 282
- 283
- 284
- 285
- 286
- 287
- 288
- 289
- 290
- 291
- 292
- 293
- 294
- 295
- 296
- 297
- 298
- 299
- 300
Copyright © 2003-2013 www.wpsshop.cn 版权所有,并保留所有权利。

