
热门标签
热门文章
- 1赛效:用创客贴快速制作封面图_csdn封面图生成
- 2unity UIFrameWork_uniframework
- 3关于Unity 中WebGL 与Http通信_unity webgl http
- 4java毕业设计——基于Java+AI的五子棋游戏设计与实现(毕业论文+程序源码)——五子棋游戏_人工智能毕业设计项目源码和论文下载
- 5AI 线性代数_线性代数 ai
- 6dpkg: error package architecture (amd64) does not match system (arm64)
- 72022年总结关于网络安全工程师职业发展方向和职业前景_网络安全行业发展与职业规划
- 8《最强Android书 架构大剖析》读书笔记_android框架揭秘 读书笔记
- 9Arm和Unity联合推出:适用于移动应用程序的3D美术优化-[3]纹理_unity texture compression 动态设置 astc
- 10Python selenium无界面headless_selenium 不显示窗口
当前位置: article > 正文
NR-PRACH接受端如何检测出preambleid和TA的_prach峰值搜索
作者:数据流舞者 | 2024-01-30 18:46:14
赞
踩
prach峰值搜索
PRACH就是利用了ZC序列的两个特点:
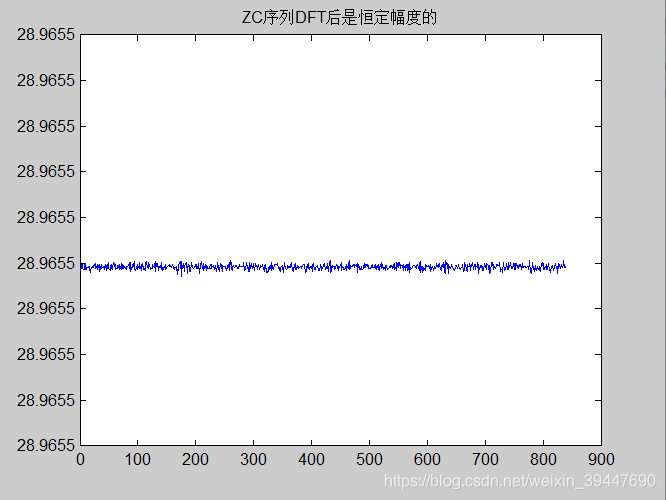
1.ZC序列具有恒定的振幅,经过DFT过后也是恒定振幅,
这样就限制了峰均比对其他用户的产生的边界和时间平坦性的影响,在计算过程中只需要考虑相位,不需要考虑振幅,这样简化了计算。
2.ZC序列具有理想的自相关特性,零互相关的特性,序列长度为L_RA,自相关后峰值为L_RA,互相关后赋值为接近0,这样就很容易检测。
第一个特性(主要是大家了解一下)
%%%%%%test dft后的幅值%%%%%%%%%%
L_RA =839
for  i = 1:1:L_RA
      x_u(i) = exp(-1i*pi*26*i*(i+1)/L_RA);
end
DFT_fre =  abs(fft(x_u,839));
plot(DFT_fre);
title('ZC序列DFT后是恒定幅度的');
- 1
- 2
- 3
- 4
- 5
- 6
- 7
- 8
第二个特性决定如何解析preambleid和TA值
我们知道prach支持最大64个用户同时接入,因为我们有64个preamid可以使用。
首先我们先生成64个不同preambleid的序列
%%%%%%%%%%%%%%%%%%%%%%%%%%%%%%%%
%%%时间:2021.01.16
%%%简要:matalb仿真prach的检测机制,进而介绍ZC序列的特性
%%%作者:通信小卒
%%%修改记录:
%%%%%%%%%%%%%%%%%%%%%%%%%%%%%%%%
clc
clear all
filename_u ='F:\4G5G\CDSN\nr-prach\table_6_3_3_1_3.xls';
filename_ncs ='F:\4G5G\CDSN\nr-prach\table_6_3_3_1_5.xls';
%TABLE_6_3_3_1_3 =
[TABLE_6_3_3_1_3,txt_u,num_u] = xlsread(filename_u);
[TABLE_6_3_3_1_5,txt_ncs,num_ncs] = xlsread(filename_ncs);
L_RA =839;

ZC_zonecfg = 5;%以非限制格式子载波间隔1.25khz为例
N_CS= TABLE_6_3_3_1_5(ZC_zonecfg+1,1);
%%%求出需要几个u才能满足64个preambleid
%%%此例子C_v=v*NCS
logic_index_i =50  ;%以长序列为例,用i求出u
seq_num =0;
for u_loop = 1:1:64
      if(seq_num<64)
              seq_num = u_loop.*floor(L_RA/N_CS);
      else
          u_loop =u_loop -1;
          break;
      end
end
%%%获取足够的u
for   u_loop_init = 1:1:u_loop
      [row_u ,column_u] = size(TABLE_6_3_3_1_3);
      row_u_x =floor( (logic_index_i+u_loop_init)/column_u)+1;
      column_u_y = mod(logic_index_i+u_loop_init-(row_u_x-1)*column_u,column_u);
      u(1,u_loop_init) = TABLE_6_3_3_1_3(row_u_x,column_u_y);
end
%%%%生成64个preamble序列
%%%除了最后一个u,使用其他的u获取preamble序列
seq_index =0;
 for   u_loop_init = 1:1:u_loop-1
         %%%%生成ZC序列
        for  i = 1:1:L_RA
               x_u(i) = exp(-1i*pi*u(1,u_loop_init)*i*(i+1)/L_RA);
        end
        %%%获取每个u对应的preamble序列
        for seq_index = seq_index :1:(seq_index+floor(L_RA/N_CS)-1)
              Cv = N_CS*mod(seq_index+1,floor(L_RA/N_CS));
              for n = 0:1:L_RA-1
              preamble_seq(seq_index+1,n+1) = x_u(mod((n+Cv),L_RA)+1);
              end
        end
 end
 %%%最后一个u生成的preamble序列
 seq_remain = 64-(u_loop-1)*floor(L_RA/N_CS);
 for  i = 1:1:L_RA
        x_u(i) = exp(-1i*pi*u(1,u_loop)*i*(i+1)/L_RA);
end
%%%获取每个u对应的preamble序列
for seq_index = seq_index+1 :1:(seq_index+seq_remain)
              Cv = N_CS*mod(seq_index+1,floor(L_RA/N_CS));
              for n = 0:1:L_RA-1
              preamble_seq(seq_index+1,n+1) = x_u(mod((n+Cv),L_RA)+1);
              end
 end
%%%生成了64个preamble序列
- 1
- 2
- 3
- 4
- 5
- 6
- 7
- 8
- 9
- 10
- 11
- 12
- 13
- 14
- 15
- 16
- 17
- 18
- 19
- 20
- 21
- 22
- 23
- 24
- 25
- 26
- 27
- 28
- 29
- 30
- 31
- 32
- 33
- 34
- 35
- 36
- 37
- 38
- 39
- 40
- 41
- 42
- 43
- 44
- 45
- 46
- 47
- 48
- 49
- 50
- 51
- 52
- 53
- 54
- 55
- 56
- 57
- 58
- 59
- 60
- 61
- 62
- 63
- 64
- 65
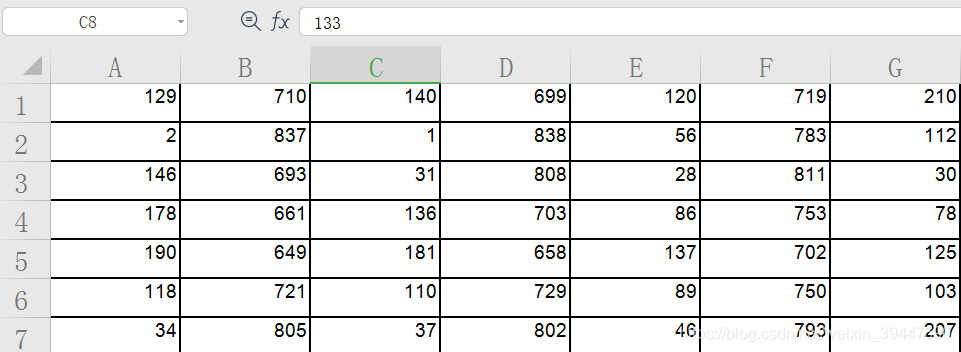
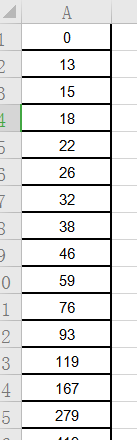
注意 这里我导入了211协议的两个excel表格
table_6_3_3_1_3为了确定u,table_6_3_3_1_5为了确定NCS的
大家可以去38.211里面去找,很容易找到,图太大貌似excel也导入不了,我截个小图,大家自己去找。
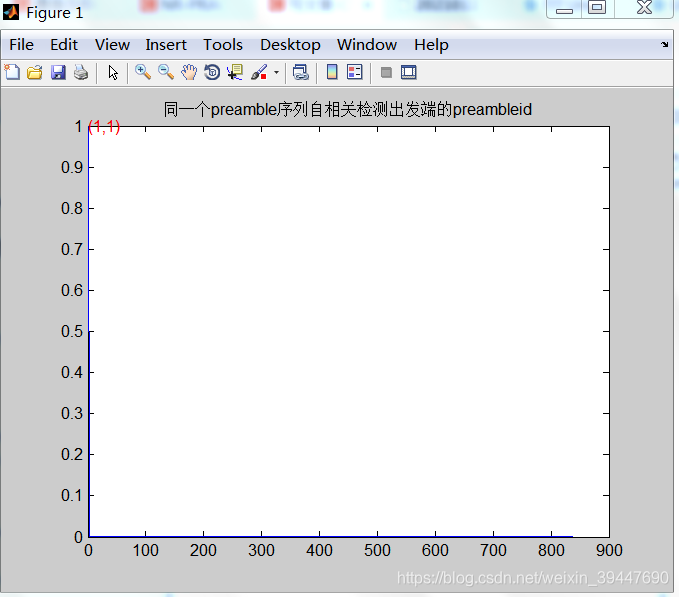
preable 序列进行自相关
峰值大小和位置:峰值位置在第一个点上,峰值是839(显示的时候除以839)
%%%测试同一个preambleid自相关的时候峰值的位置%%%
%%%时域相关等于频域共轭相乘%%%%%%

test_com_id_fre = fft(preamble_seq(1,:),839).*conj(fft(preamble_seq(1,:),839));
test_com_id_time = abs(ifft(test_com_id_fre,839))./L_RA;
figure(1);
plot(test_com_id_time);
title('同一个preamble序列自相关检测出发端的preambleid');
[y_max,x_max] = max(test_com_id_time);
text(x_max,y_max,['(',num2str(x_max),',',num2str(y_max),')'],'color','r');
- 1
- 2
- 3
- 4
- 5
- 6
- 7
- 8
- 9
- 10
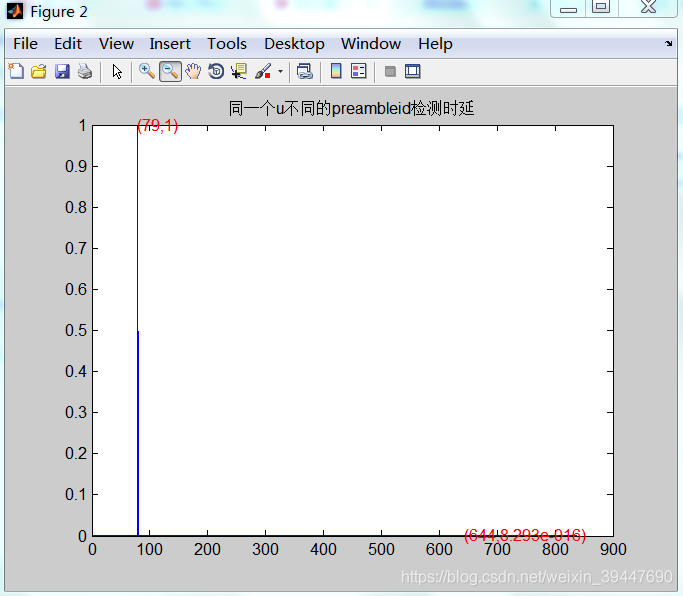
不同的preamble 序列进行互相关
发端preamble id是1 收端用4去检测
检测出来的时延应该是 NCS3 =263=78
%%%%%%%%同一个u不同的preambleid检测时延%%%%%%%%%
%%%preambleid 1和preambleid 3%%%
test_com_id_fre = fft(preamble_seq(1,:),839).*conj(fft(preamble_seq(4,:),839));
test_com_id_time = abs(ifft(test_com_id_fre,839))./L_RA;
figure(2);
plot(test_com_id_time);
title('同一个u不同的preambleid检测时延');
[y_max,x_max] = max(test_com_id_time);
text(x_max,y_max,['(',num2str(x_max),',',num2str(y_max),')'],'color','r');
[y_min,x_min] = min(test_com_id_time);
text(x_min,y_min,['(',num2str(x_min),',',num2str(y_min),')'],'color','r');
- 1
- 2
- 3
- 4
- 5
- 6
- 7
- 8
- 9
- 10
- 11
- 12
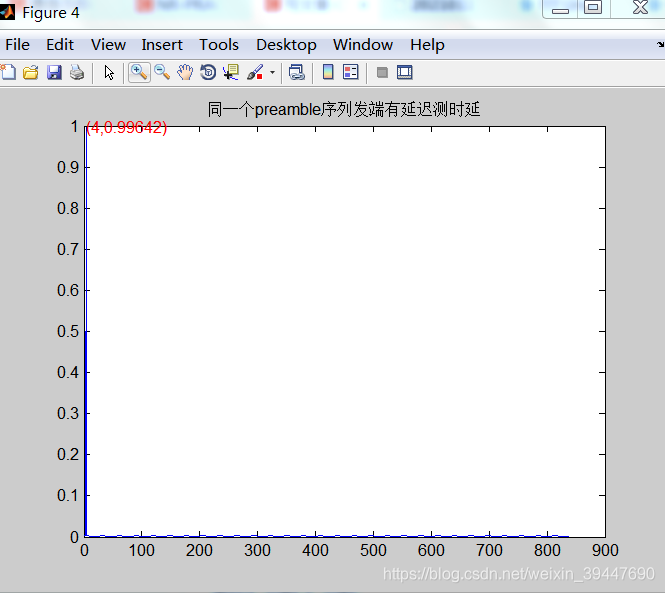
收端用和发端相同的preamble序列,但是发端有一定是时延
此处我们模拟了4个点的时延,每个点代表多少时延的实际长839个点的时间和我们协议中以format0为例,24576K占用的时间是一致的,自己推到一下就行。
%%%%%%%%检测preamble内部的时延%%%%%%%%%%%%%
preamble_seq_delay =[preamble_seq(1,4:839),[0 0 0]]
test_com_id_fre = fft(preamble_seq(1,:),839).*conj(fft(preamble_seq_delay,839));
test_com_id_time = abs(ifft(test_com_id_fre,839))./L_RA;
figure(4);
plot(test_com_id_time);
title(‘同一个preamble序列发端有延迟测时延’);
[y_max,x_max] = max(test_com_id_time);
text(x_max,y_max,[’(’,num2str(x_max),’,’,num2str(y_max),’)’],‘color’,‘r’);
发端发的是preambleid 是4和5(两个ue同时接入),收端用4去解
可以解出来发端的preamble是4,这个也说明了不同preamble序列相互叠加是不影响的。
%%%%%%发端发的是preambleid 是4和5(两个ue同时接入),收端用4去解
%%%相关就可以解析出对应的preambleid
for n = 0:1:L_RA-1
send_seq(1,n+1) = preamble_seq(4,n+1)+preamble_seq(5,n+1);
end
test_com_id_fre = fft(send_seq(1,:)).*conj(fft(preamble_seq(4,:),839));
test_com_id_time = abs(ifft(test_com_id_fre,839))./L_RA;
figure(6);
plot(test_com_id_time);
title('preambleid 是4和5(两个ue同时接入),收端检测出4');
[y_max,x_max] = max(test_com_id_time);
text(x_max,y_max,['(',num2str(x_max),',',num2str(y_max),')'],'color','r');
- 1
- 2
- 3
- 4
- 5
- 6
- 7
- 8
- 9
- 10
- 11
- 12
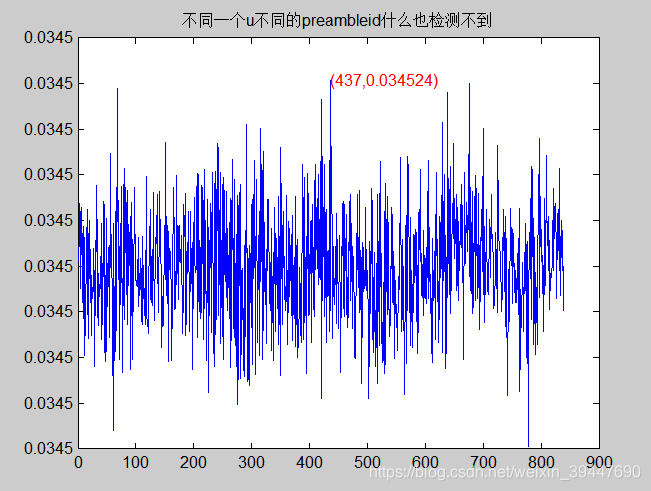
不同一个u对应的的preamble序列是检测不出时延的
%%%%%%%%不同一个u不同的preambleid什么也检测不到%%%%%%,
%%%preambleid 1和preambleid 40%%%
test_com_id_fre = fft(preamble_seq(1,:),839).*conj(fft(preamble_seq(40,:),839));
test_com_id_time = abs(ifft(test_com_id_fre,839))./L_RA;
figure(3);
plot(test_com_id_time);
title('不同一个u不同的preambleid什么也检测不到');
[y_max,x_max] = max(test_com_id_time);
text(x_max,y_max,['(',num2str(x_max),',',num2str(y_max),')'],'color','r');
- 1
- 2
- 3
- 4
- 5
- 6
- 7
- 8
- 9
- 10
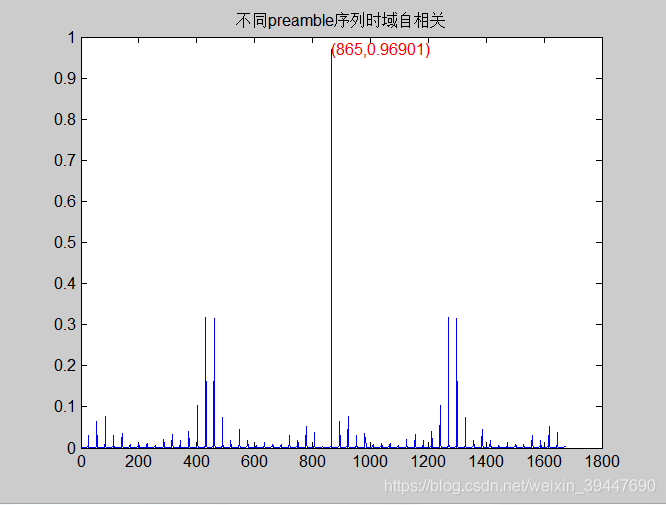
最后说一下前面的相关都是转到频域共轭相乘实现的,当然时域本身可以直接先关来实现
时域直接相关点数变成2N-1,只需要看右边就可以,865-839=26,检测出了时延。
%%%%%%时域相关%%%%%%%%%%%%%%
test_com_id_time = abs(xcorr(preamble_seq(40,:),preamble_seq(41,:)))./L_RA;
figure(5);
plot(test_com_id_time);
title('不同preamble序列时域自相关');
[y_max,x_max] = max(test_com_id_time);
text(x_max,y_max,['(',num2str(x_max),',',num2str(y_max),')'],'color','r');
- 1
- 2
- 3
- 4
- 5
- 6
- 7
声明:本文内容由网友自发贡献,不代表【wpsshop博客】立场,版权归原作者所有,本站不承担相应法律责任。如您发现有侵权的内容,请联系我们。转载请注明出处:https://www.wpsshop.cn/article/detail/47928
推荐阅读


相关标签

