
热门标签
热门文章
- 1自注意力机制(Self-Attention)
- 24、DRF实战总结:序列化器(Serializer)、数据验证、重写序列化器方法详解(附源码)_drf serialization
- 3薪资17K是一个怎样的水平?来看看98年测试工程师的面试全过程…_测试工程师17k高吗
- 4动态规划专题——背包问题_动态规划背包问题
- 5ubuntu20.04安装完没有连接wifi的选项,ubuntu网卡驱动_ubuntu20.04没有连接wifi选项
- 6数字政府!3DCAT实时云渲染助推上海湾区数字孪生平台
- 7Mybatis配置动态数据源以及参数传递等
- 8C++基础语法详解_c++基本语法
- 9【Unity 优化篇】 | 优化专栏《导航帖》,全面学习Unity优化技巧,让我们的Unity技术上升一个档次
- 10Python海龟turtle基础知识大全与画图集合_python海龟编程代码大全
当前位置: article > 正文
Opencv提取照片hsv分量并绘制hsv直方图_opencv 获取hue分量
作者:程序安全守护者 | 2024-01-30 13:26:54
赞
踩
opencv 获取hue分量
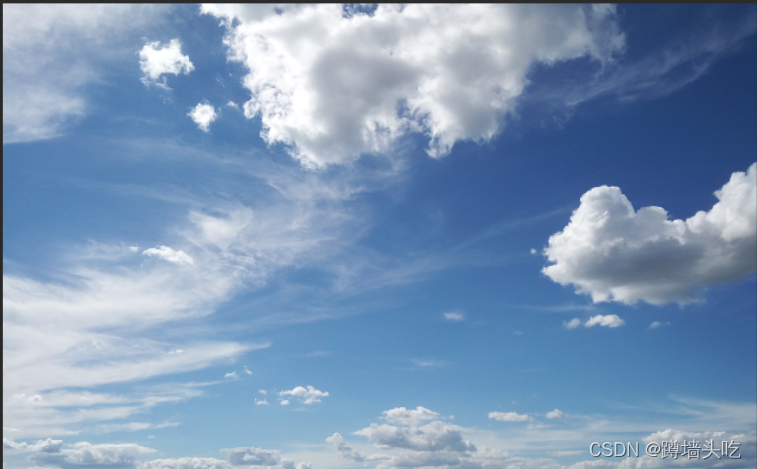
原图
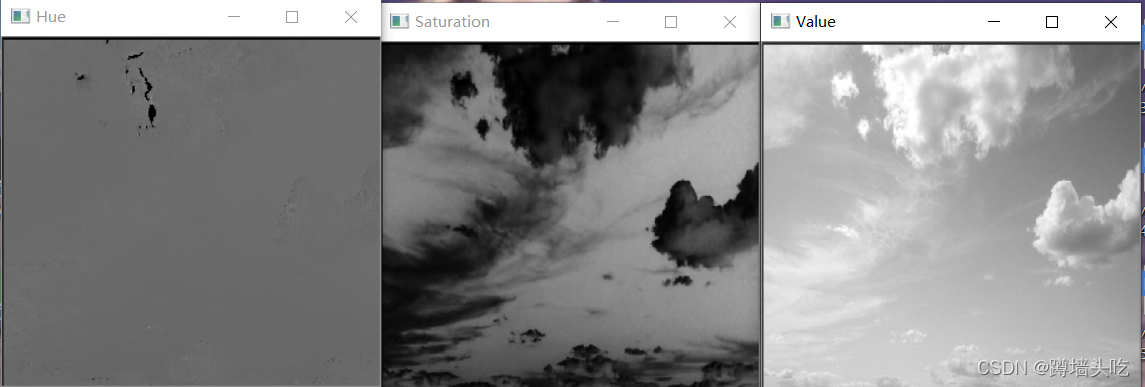
hsv各分量提取结果
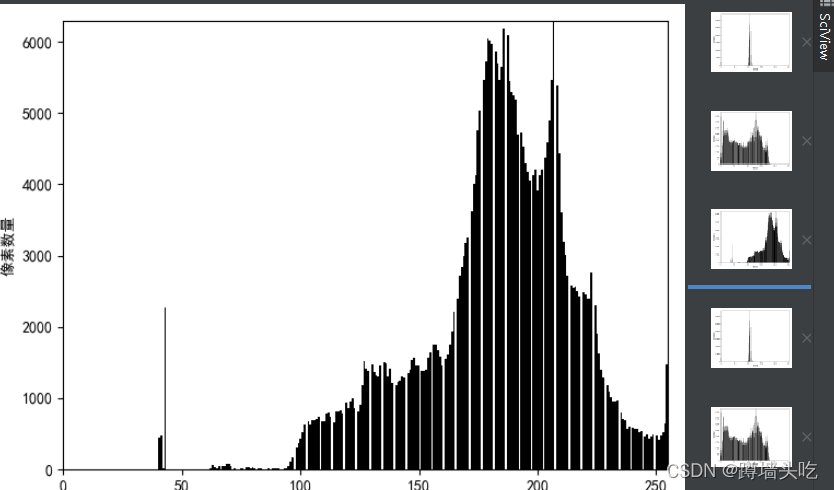
hsv直方图提取结果(以value为例)
附代码
- # -*- coding:utf-8 -*-
-
- import cv2
- import numpy as np
- import matplotlib.pyplot as plt
-
- def grayHist(img, name):
- h, w = img.shape[:2]
- pixelSequence = img.reshape([h * w, ])
- numberBins = 256
- histogram, bins, patch = plt.hist(pixelSequence, numberBins,
- facecolor='black', histtype='bar')
- plt.rcParams['font.sans-serif'] = ['SimHei']
- plt.rcParams['axes.unicode_minus'] = False
- plt.xlabel("像素值")
- plt.ylabel("像素数量")
- plt.axis([0, 255, 0, np.max(histogram)])
- plt.savefig("E:/save/" + name + ".png")
- plt.show()
-
- img = cv2.imread("test.png") #导入图片,图片放在程序所在目录
- cv2.namedWindow("imagshow", 2) #创建一个窗口
- cv2.imshow('imagshow', img) #显示原始图片
-
- #使用cvtColor转换为HSV图
- out_img_HSV=cv2.cvtColor(img,cv2.COLOR_BGR2HSV)
- hsvChannels=cv2.split(out_img_HSV)
-
- cv2.namedWindow("Hue",2)
- cv2.imshow('Hue',hsvChannels[0]) #显示Hue分量
- grayHist(hsvChannels[0],"H-Histogram")
- cv2.namedWindow("Saturation",2)
- cv2.imshow('Saturation',hsvChannels[1]) #显示Saturation分量
- grayHist(hsvChannels[1],"S-Histogram")
- cv2.namedWindow("Value",2)
- cv2.imshow('Value',hsvChannels[2]) #显示Value分量
- grayHist(hsvChannels[2],"V-Histogarm")
-
- cv2.waitKey(0)

声明:本文内容由网友自发贡献,不代表【wpsshop博客】立场,版权归原作者所有,本站不承担相应法律责任。如您发现有侵权的内容,请联系我们。转载请注明出处:https://www.wpsshop.cn/article/detail/46620
推荐阅读


相关标签

