
热门标签
热门文章
- 1Educational Codeforces Round 161 (Rated for Div. 2)补题
- 2SpringBoot - @InitBinder注解详解
- 3我的wsl不见了_wsl突然找不到了
- 4MYSQL之错误代码----mysql错误代码与JAVA实现
- 5Ubuntu 20.04 ROS Noetic及Realsense-ROS的安装和多机通信_noetic realsense
- 6JAVA开发(AOP之ProceedingJoinPoint)_proceedingjoinpoint 获取参数
- 7【硬核】源码 + 案例分享 JDK8 新特性中的四大函数式接口_jdk8四大函数
- 8美团BERT的探索和实践 | CSDN原力计划
- 9力扣 707. 设计链表_力扣 设计链表
- 10opencv学习 特征提取
当前位置: article > 正文
【Pandas】Python数据分析活用Pandas库学习笔记(一)_python数据分析活用pandas库 pdf
作者:程序自动化专家 | 2024-01-29 20:50:49
赞
踩
python数据分析活用pandas库 pdf
Python数据分析活用Pandas库学习笔记
引言
Python数据分析活用Pandas库学习笔记,博客中涉及的数据文件,下载下面的连接
数据资料链接:https://www.ituring.com.cn/book/download/37deb472-af30-4444-b791-92f983fe00c9
第1章 Pandas DataFrame 基础知识
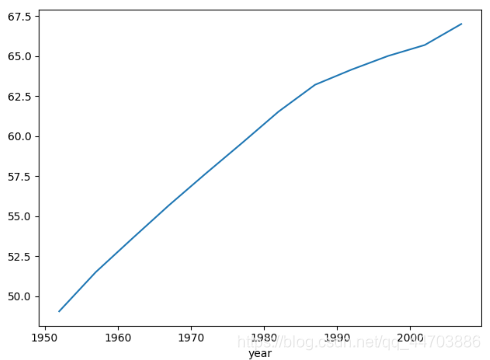
"""
2021.02.18
author:alian
"""
import pandas as pd
import matplotlib.pyplot as plt

df = pd.read_csv(r'D:\Python数据分析\Pandas\pandas_for_everyone-master\data\gapminder.tsv',sep='\t')  # 显示指明使用制表符分隔

# print(df.head())  # 获取前5行数据
# print(type(df))  # 获取对象类型
# print(df.shape)  # 获取对象的形状
# print(df.columns)  # 获取对象的列名
# print(df.dtype)  # 获取每列的类型
# print(df.info())  # 获取更多的数据信息

# 获取列子集
sub_df = df['country']
# print(sub_df.head())
# print(sub_df.tail())  # 显示后5行
sub_set = df[['country','continent','year']]  # 指定多列

# 获取行子集
# 基于索引标签获取
row1_df = df.loc[0]  # 第一行
rowlast_df = df.tail(n=1)  # 最后一行
# print(df.loc[[1,99,999]])
# 基于行号获取
row0_df = df.iloc[0]  # 第一行
row_df= df.iloc[-1]  # 最后一行

# 切片语法
# print(df.iloc[:, 0:6:2])  # 0-5列,步长为2
# print(df.iloc[:, 0:6:])  # 0-5列,步长为1
# print(df.iloc[:, 0::2])  # 0-最后一列,步长为2
# print(df.iloc[:, :6:2])  # 0-5列,步长为2
# print(df.iloc[:, ::2])  # 0-最后一列,步长为2
# print(df.iloc[:, ::])  # 0-最后一列,步长为1

# 分组和聚合计算
group = df.groupby('year')['lifeExp'].mean()
print(group)
group.plot()  # 绘制基本图形
plt.show()  # 一定要显示

- 1
- 2
- 3
- 4
- 5
- 6
- 7
- 8
- 9
- 10
- 11
- 12
- 13
- 14
- 15
- 16
- 17
- 18
- 19
- 20
- 21
- 22
- 23
- 24
- 25
- 26
- 27
- 28
- 29
- 30
- 31
- 32
- 33
- 34
- 35
- 36
- 37
- 38
- 39
- 40
- 41
- 42
- 43
- 44
第2章 Pandas数据结构
"""
2021.02.18
author:alian
Pandas 数据结构
Series相当于python内置的列表;DataFrame相当于python内置的字典
"""
import pandas as pd
import matplotlib as plt
import random

s = pd.Series(['banada','42'])
# print(s)
# 创建数据框
scientists = pd.DataFrame({
    'Name':['RosalineFranklin','William Gosset'],
    'Occupation':['Chemist','Statistician'],
    'Born':['1920-07-25','1876-06-13'],
    'Died':['1958-04-16','1937-10-16'],
    'Age':[37,61]
})
# print(scientists)
# 参数index:指定索引列;columns:指定列顺序
scientists1 = pd.DataFrame(
    data={
    'Name':['RosalineFranklin','William Gosset'],
    'Occupation':['Chemist','Statistician'],
    'Born':['1920-07-25','1876-06-13'],
    'Died':['1958-04-16','1937-10-16'],
    'Age':[37,61]
},
index = ['RosalineFranklin','William Gosset'],
columns = ['Occupation','Born','Died','Age'])
# print(scientists1)
# print(type(scientists1))
row = scientists1.loc['William Gosset']
# print(type(row))  # DataFrame的行对象得到一个Series对象,
# print(row.index)  # Series的索引属性
# print(row.values)  # Series的值属性
# print(row.keys())  # 等价于index属性

# Pandas.Series==numpy.ndarray
# 详见Serise的属性和方法

# 布尔子集:Serise
scientists = pd.read_csv(r'D:\Python数据分析\Pandas\pandas_for_everyone-master\data\scientists.csv')
ages = scientists['Age']
# print(ages)
# 获取基本统计量
# print(ages.describe())
# print(ages[ages>ages.mean()])  # 获取大于平均值的年龄
# print(ages>ages.mean())  # 判断年龄是否大于年龄均值
bool_index = [True,True,False,False,True,True,False,True]  # 用bool来索引
# print(ages[bool_index])
# print(ages.sort_index(ascending=False))

#  DataFrame
# 布尔子集:DataFrame
# print(scientists[scientists['Age']>scientists['Age'].mean()])

# 更改DataFrame和Serise
# 将Born列格式化为datetime
born_datatime = pd.to_datetime(scientists['Born'],format='%Y-%m-%d')
# print(born_datatime)
# 对列值进行随机化
# 方法一:设置随机种子,产生相同的随机数序列
random.seed(42)
random.shuffle(scientists['Age'])
# print(scientists['Age'])
# 方法二:使用random_state减少随机化()
scientists['Age'] = scientists['Age'].sample(len(scientists['Age']),random_state=24).reset_index(drop=True)
# 说明:reset_index(drop=True)为了仅打乱值,而不是携带索引的值,否则无法进行数值打乱
print(scientists['Age'])

# 删除值,axis = 1删除列,axis = 0 删除行
scientists_dropped = scientists.drop(['Age'],axis=1)
- 1
- 2
- 3
- 4
- 5
- 6
- 7
- 8
- 9
- 10
- 11
- 12
- 13
- 14
- 15
- 16
- 17
- 18
- 19
- 20
- 21
- 22
- 23
- 24
- 25
- 26
- 27
- 28
- 29
- 30
- 31
- 32
- 33
- 34
- 35
- 36
- 37
- 38
- 39
- 40
- 41
- 42
- 43
- 44
- 45
- 46
- 47
- 48
- 49
- 50
- 51
- 52
- 53
- 54
- 55
- 56
- 57
- 58
- 59
- 60
- 61
- 62
- 63
- 64
- 65
- 66
- 67
- 68
- 69
- 70
- 71
- 72
- 73
- 74
- 75
- 76
2.1 Serise
2.1.1 Serise的属性
| Serise属性 | 说明 |
|---|---|
| loc | 使用索引标签取子集 |
| iloc | 使用索引号取子集 |
| dtype或dtypes | Serise内容的类型 |
| T | Serise的转置矩阵 |
| shape | 数据维度 |
| size | Serise元素的数量 |
| values | 类似与ndarray的Serise |
2.1.2 Serise的方法
| Serise方法 | 说明 |
|---|---|
| describe | 获取Serise 的基本统计量,包括数量、均值、最大值、最小值等 |
| append | 连接两个或多个Serise |
| corr | 计算与另一个Serise的相关系数* |
| cov | 计算与另一个Serise的协方差* |
| describe | 计算概括统计量* |
| drop_duplicates | 返回一个不含重复项的Serise |
| equals | 判断两个Serise是否有相同元素 |
| get_values | 获取Serise的值,功能和values属性相同 |
| hist | 绘制直方图 |
| isin | 逐个检查Serise中的每个元素是否存在于参数指定的序列中 |
| min | 返回最小值 |
| max | 返回最大值 |
| mean | 返回平均数 |
| std | 返回标准差 |
| median | 返回中位数 |
| mode | 返回众数 |
| quantile | 返回指定位置的四分位数 |
| replace | 用指定值代替Serise中的值 |
| sample | 返回Serise的随机采样值 |
| sort_values | 对值进行排序 |
| to_frame | 把Serise转换为DataFrame |
| transpose | 返回转置矩阵 |
| unique | 返回由唯一值组成的numpy.ndarray |
2.2 DataFrame
获取DataFrame子集的一些方法
| 方法 | 执行结果 |
|---|---|
| df[column_name] | 单列 |
| df[[column1,column2,…]] | 多列 |
| df.loc[row_label] | 使用行标签(行名)获取数列行 |
| df.loc[[label1,label2,…]] | 使用索引标签获取多行 |
| df.iloc[row_number] | 使用行号获取数据行 |
| df.iloc[[row1,row2,…]] | 使用行号获取多行 |
| df[bool] | 使用布尔值获取行 |
| df[[bool1,bool2,…]] | 使用布尔值获取多行 |
| df[start:stop:step] | 使用切片方法获取数据行 |
导出数据的方法
| 导出方法 | 说明 |
|---|---|
| to_pickle | 把数据保存为二进制格式 |
| to_csv | 把数据保存为csv格式 |
| to_excel | 把数据保存为excel格式 |
| to_feather | 将数据储存二进制对象 |
| to_clipboard | 把数据保存到系统剪贴板,方便粘贴 |
| to_dense | 把稀疏对象转换为标准密集形式 |
| to_dict | 把数据转换为标准python字典 |
| to_gbq | 把数据转换为Goolgle BigQuery表 |
| to_hdf | 把数据保存为HDP格式 |
| to_msgpack | 把数据保存为类似JSON的便携二进制格式 |
| to_html | 把数据转换为HTML表 |
| to_json | 把数据转换成JSON字符串 |
| to_latex | 把数据转换成LaTex表格环境 |
| to_records | 把数据转换成记录数组 |
| to_string | 把标准输出以字符串形式显示DataFrame |
| to_sparse | 把数据转换为SparceDataFrame |
| to_aql | 把数据保存到SQL数据库 |
| to_stata | 把数据转换成Stata dta文件 |
声明:本文内容由网友自发贡献,版权归原作者所有,本站不承担相应法律责任。如您发现有侵权的内容,请联系我们。转载请注明出处:【wpsshop博客】
推荐阅读


相关标签

